KPIs Show the Value of Direct Bookings, but Airbnb is Quickly Gaining Ground as a Percentage of Total Revenue
The following data sets were provided by Key Data and represent 2020 and 2021 booking data for professionally managed US vacation rentals year to date (TYD) as of September 8 for both years.
The barrier to entry for starting a vacation rental management company is currently low. New companies form easily and often, and they’re able to secure bookings and revenue simply by listing rental homes on Airbnb and Vrbo. This is possible because the industry is experiencing high consumer demand and constrained supply. Although demand for vacation rentals has been steadily increasing for over a decade, it catapulted during the pandemic as leisure travelers flocked to home rentals instead of hotels and cruise lines, and the existing supply of available vacation rentals has not kept up with demand.
However, solely listing homes on Airbnb and Vrbo is not a sustainable marketing strategy. Travel behavior is cyclical when demand compresses and supply catches up, simply listing homes on Airbnb and Vrbo will not bring in enough revenue to support current business models. Building direct business is critical for long-term success.
All Bookings Are Not Equal
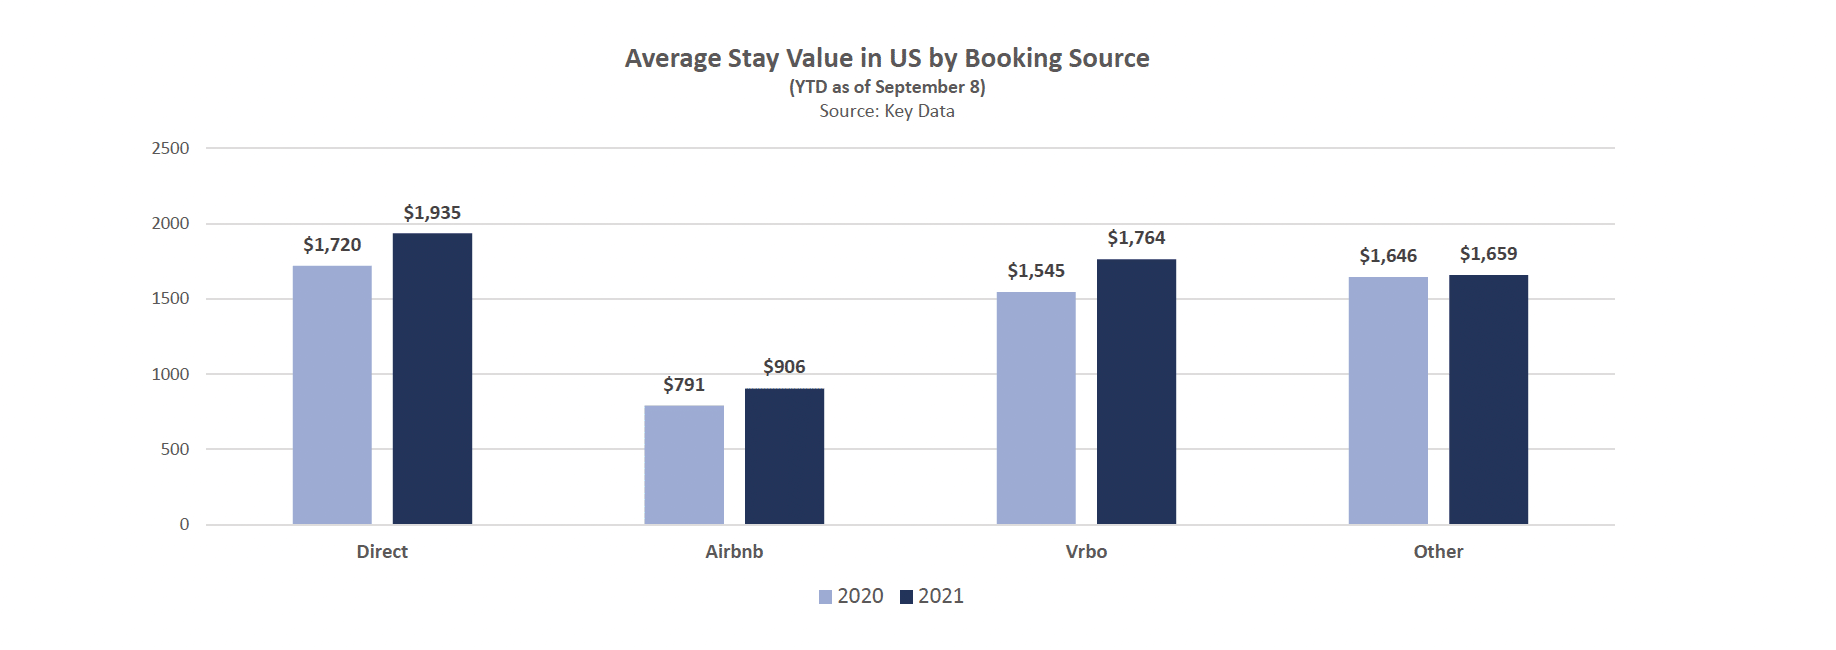
All bookings are valuable, but all are not equally valuable. The chart below shows average stay values (ASV) for US bookings across channels.
In 2021, the ASV for direct bookings year-to-date (YTD) as of September 8 was $1,935, up 13 percent from 2020. In contrast, the ASV on Vrbo was 9 percent lower at $1,764.
But take a look at Airbnb, which had an ASV of $906, more than 53 percent lower than direct. You’ll see as you continue reading, the difference in ASVs is the result of a combination of higher average daily rates (ADRs) and longer stays for direct bookings.
Another way to look at it is that it takes 2+ bookings on Airbnb to equal one direct reservation.
Although revenue is important, there are other reasons direct bookings are more valuable:
Lower costs of acquisition over time
Longer lengths of stays
Longer booking windows
Increased ability to communicate and manage guest expectations
More opportunities to vet guests and spot potential problems early
More repeat stays
Less wear and tear on properties
Less burden on housekeeping and operations
Increased homeowner satisfaction
How Understanding Performance Data Affects Revenue Management Strategy
At the recent Vacation Rental Data and Revenue Management (DARM) Conference, attendees discussed how and why revenue management strategies should differ across channels, as consumers behave differently depending on which channel they are using. For example, Airbnb’s guests are more likely to book shorter stays and more last-minute stays.
We also learned that the main levers revenue managers pull to affect performance are rate, minimum stay requirements, and booking window (days between the reservation date and booking date). Revenue management success requires:
a strong grasp of property and benchmark performance data
an understanding of how channels perform for different regions and property types
skill and optimizing listings on each channel
Let’s take a broad look at US performance across channels, dive deeper into regional performance, and then drill down even further into rental performance by bedroom size.
US Vacation Rental Performance KPIs
by Booking Source
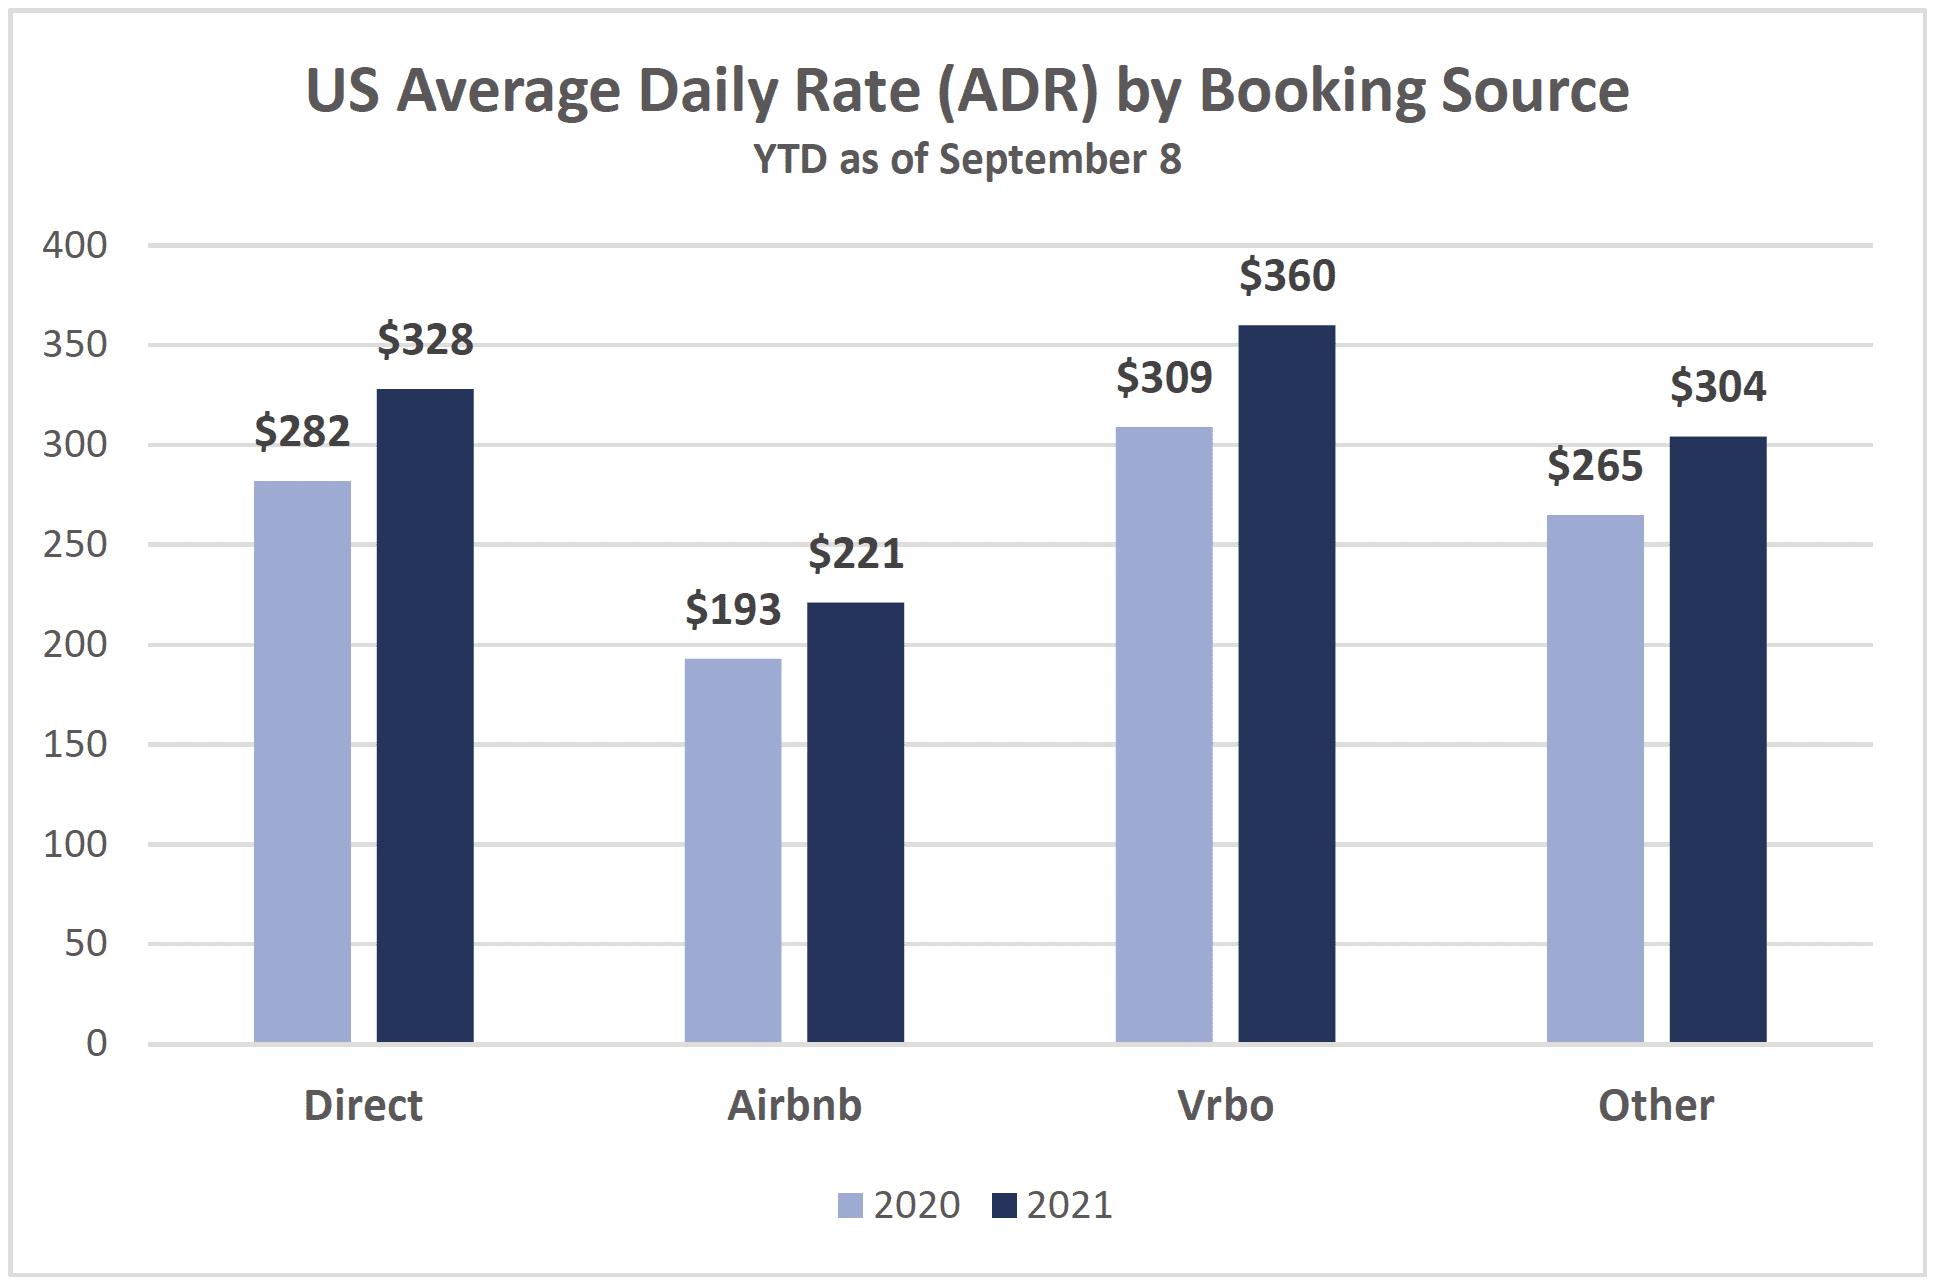
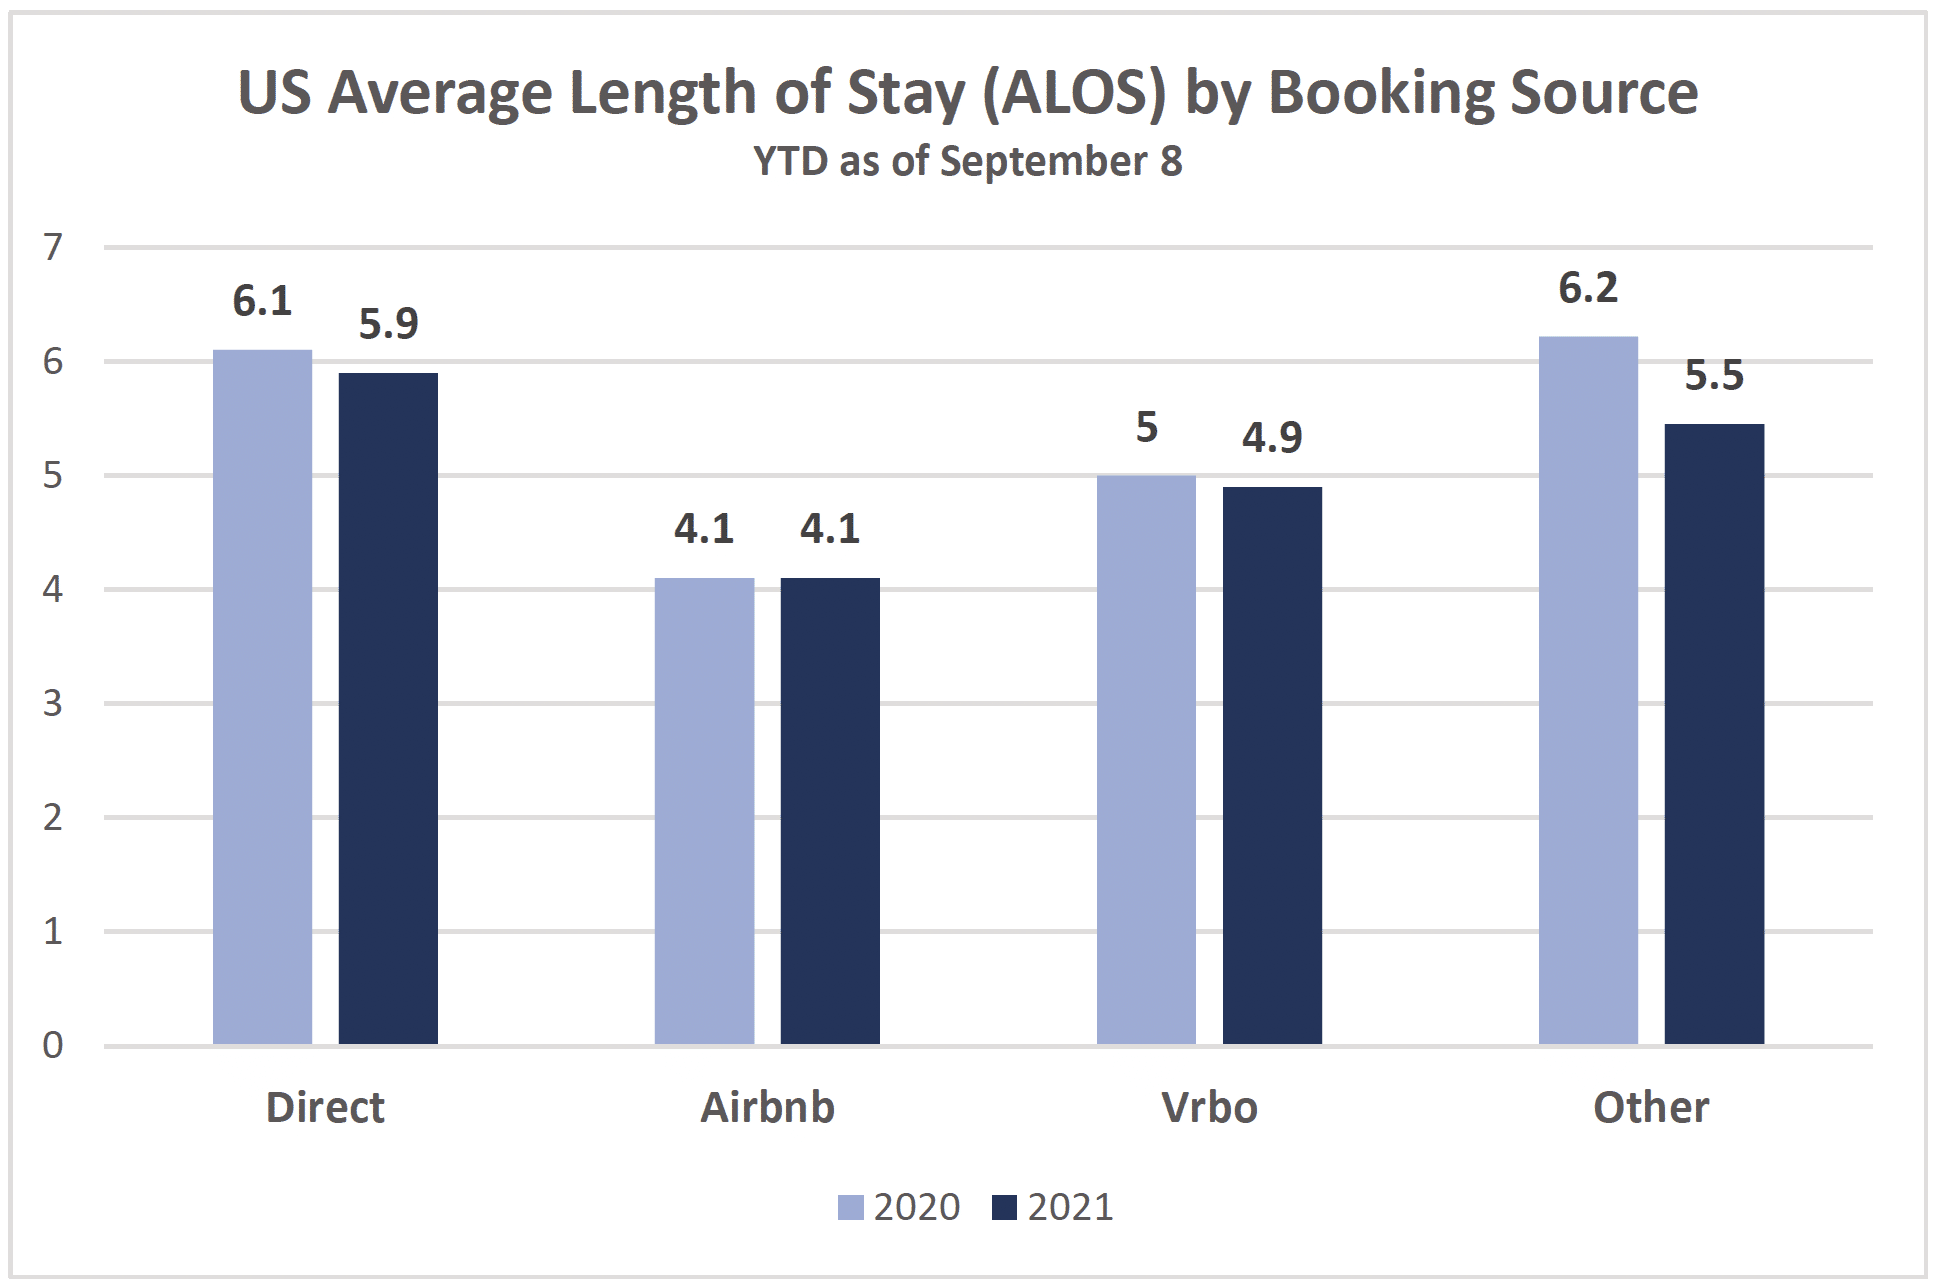
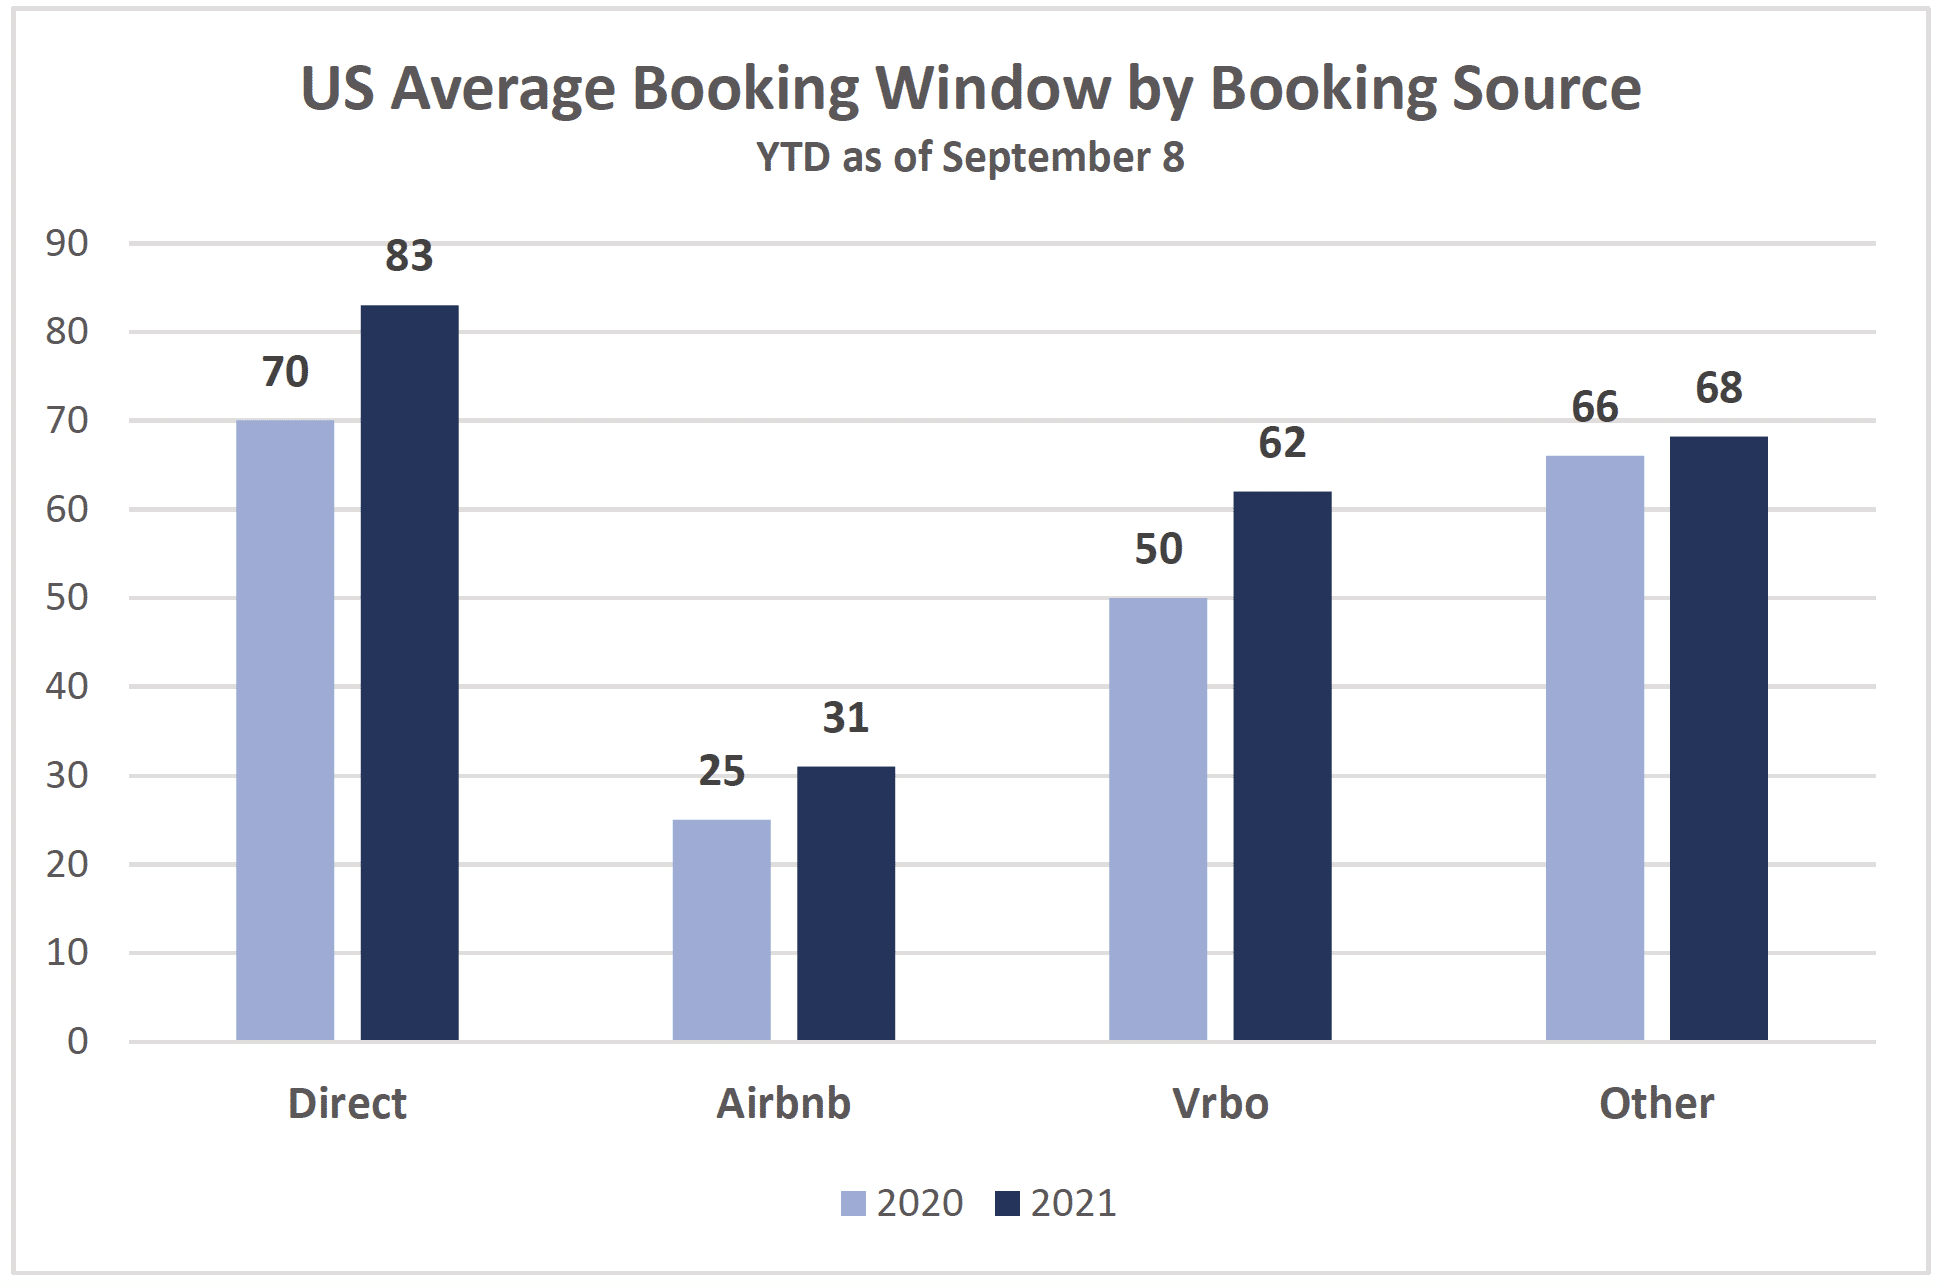
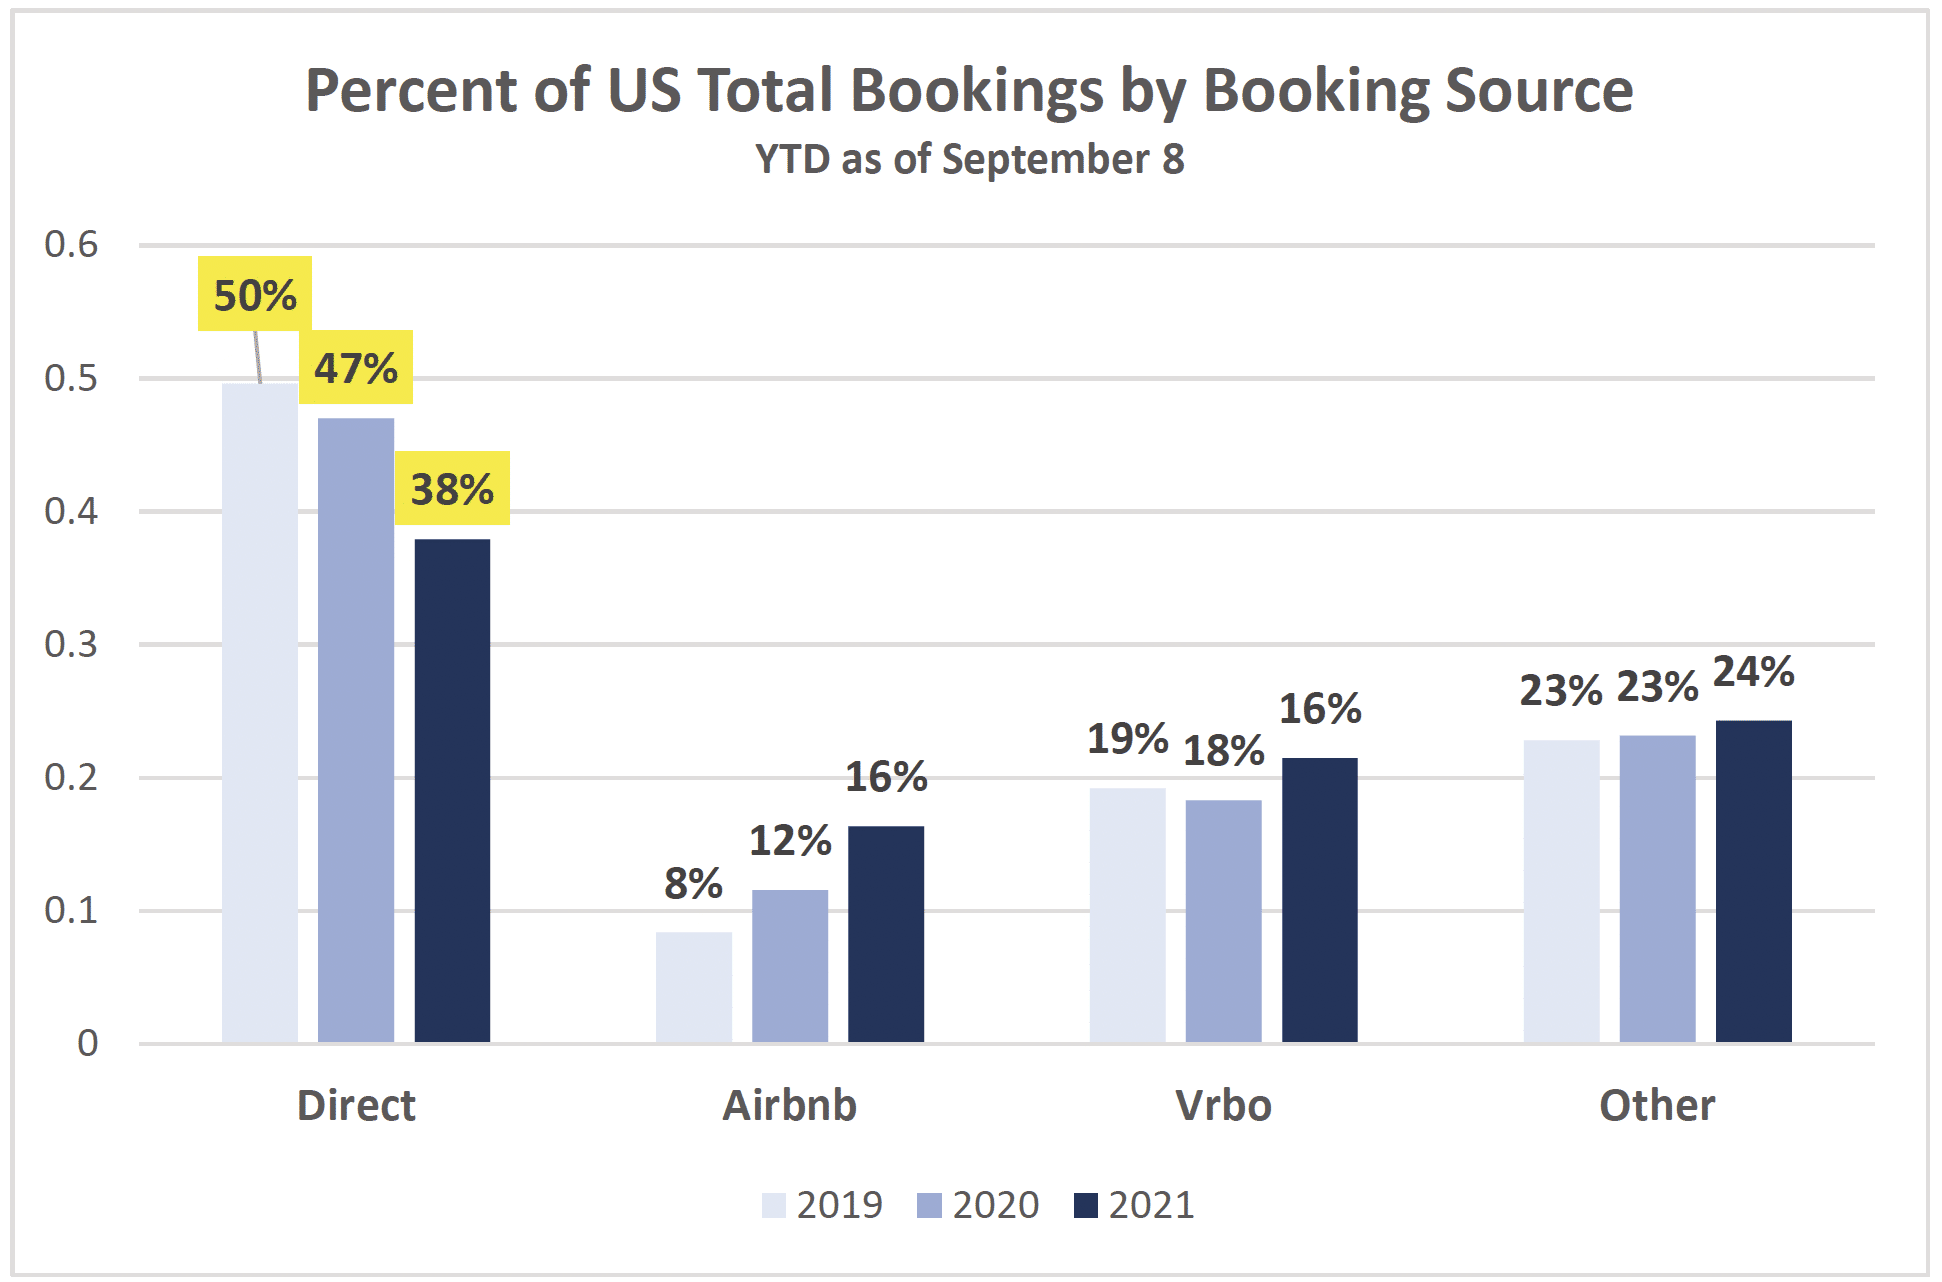
The four charts below examine ADR, average length of stay, average booking window, and percentage of total revenue by channel.
Increased demand allowed property managers to increase rates resulting in higher ADRs, which we saw in most US leisure markets. The shorter average length of stay and longer average booking window in 2021 over 2020 represent a slow return to 2019 numbers (read more on page 76).
Notably, all three of these KPIs were significantly lower on Airbnb compared to other channels. Comparing direct bookings to Airbnb, ADR was 34 percent lower, the average length of stay was 31 percent smaller, and the average booking window was a whopping 63 percent shorter for bookings on Airbnb.
The most concerning number is found in the Percentage of Total Revenue by Booking Source chart, which shows that direct bookings as a percentage of total revenue decreased 20 percent in 2021 (47 percent in 2020 vs 38 percent in 2021).
Regional Key Performance Indicators (KPIs) for Professionally Managed Vacation Rentals
(YTD as of September 8)
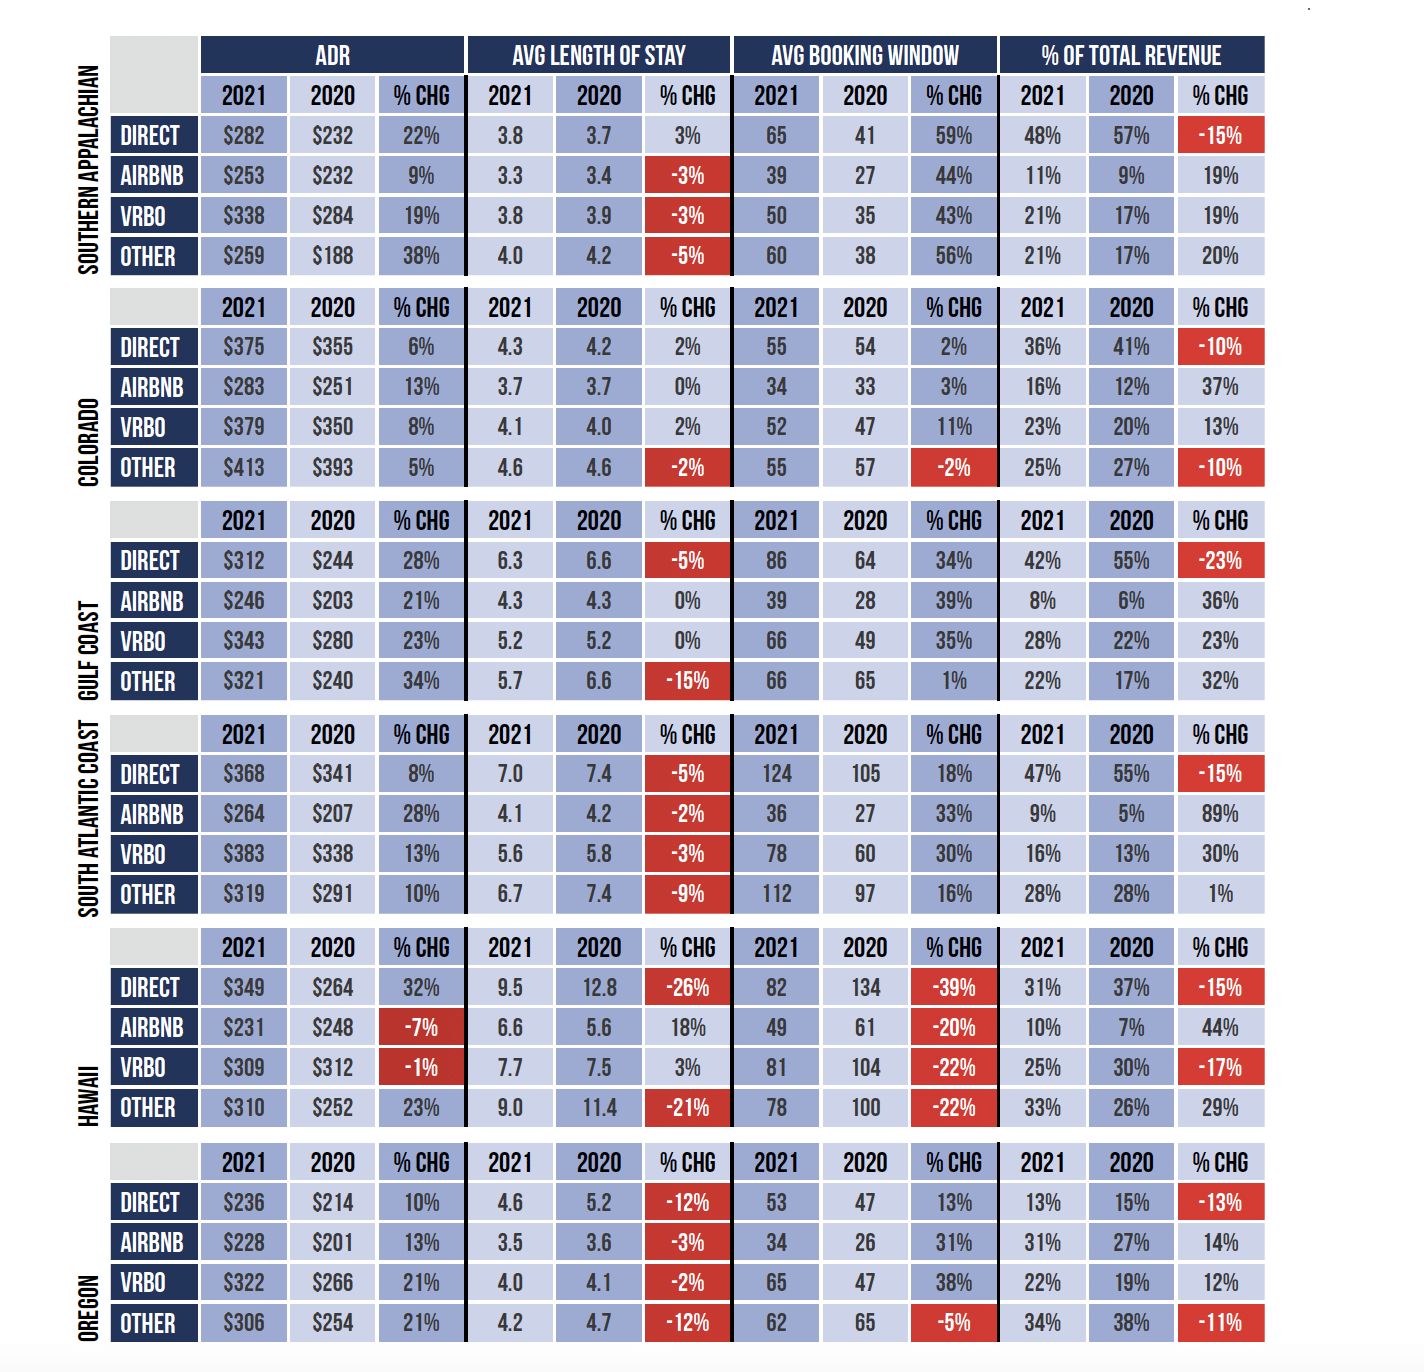
Although it is important to monitor national trend benchmarking, the real value comes by tracking the market(s) in which properties are located. In the regional tables below, a few KPIs stand out. For example, in each of these regions, the percentage of total revenue for direct bookings dropped by double digits.
The Gulf Coast saw the biggest hikes in ADRs. In the Southern Appalachian region (which includes mountain regions in Tennessee, Georgia, and North Carolina), the average length of stay dropped on all third-party channels but increased for direct bookings. Colorado is the only region we examined with over 16 percent of revenue coming from Airbnb, and the Southeast Atlantic Coast is the only region with less than 20 percent of revenue coming from Vrbo. Additionally, the Southeast Atlantic Coast and Oregon are the only regions with an overall decline in the length of stay in 2021 across all channels. Hawaii’s KPIs are skewed because of hefty travel restrictions in 2020. As property managers assess their own market(s), they are also able to compare their companies’ performance to regional performance.
KPIs by Property Size
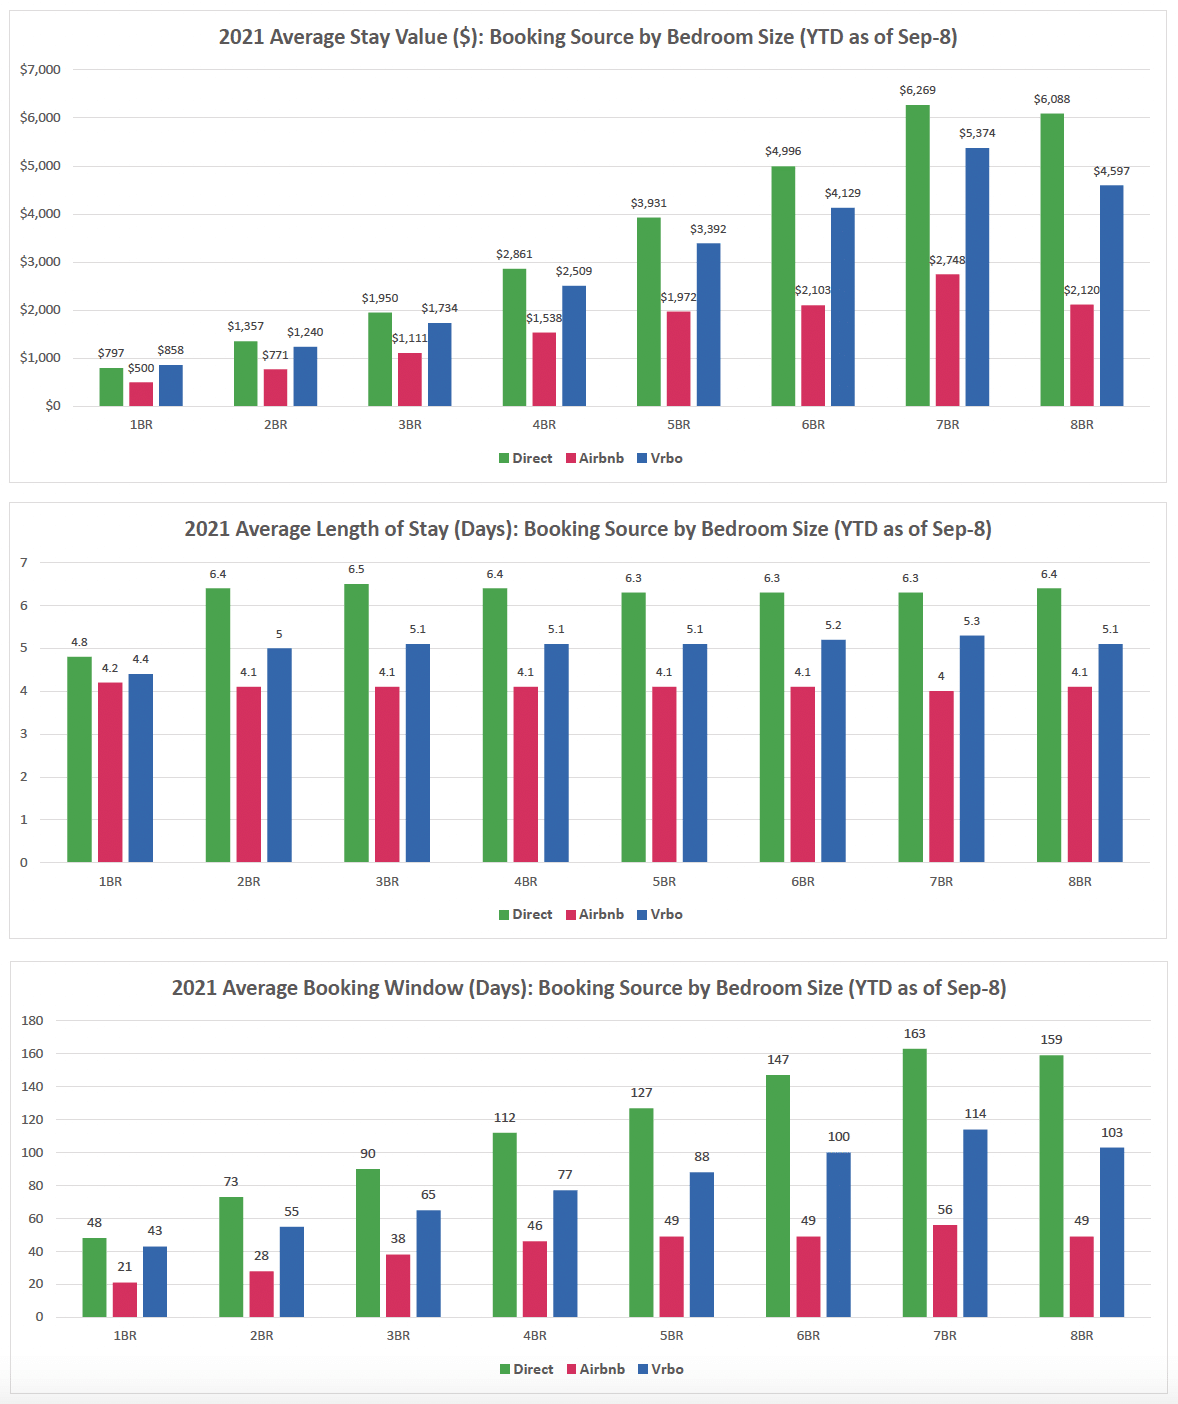
Analyzing data by property size helps challenge assumptions. The charts below reveal channel performance by bedroom size for direct bookings and for Airbnb and Vrbo. The ASV is considerably lower on Airbnb, regardless of bedroom size, although the canyon increases with the size of the home.
Looking at average length of stay for one-bedroom properties, bookings on Airbnb are just .6 days shorter than direct bookings and .2 days shorter than Vrbo. However, for properties with more than one bedroom, stays are consistently two days shorter on Airbnb than for direct bookings.
It is also true that more Airbnb guests book at the last minute than guests booking on Vrbo or directly with property managers, and the gap becomes more pronounced as the number of bedrooms increases. For example, for homes with seven to eight bedrooms, the booking window is 66–69 percent shorter on Airbnb than on direct channels and over 50 percent shorter than on Vrbo.



Comments are closed.