Experts in many fields, from economics to health care, have referred to COVID-19 as an accelerator that escalated shifts in societal behavior. The pandemic has certainly accelerated the growth and maturation that was already happening within the vacation rental industry.
The pandemic also sped up the sector’s increasing dependency on vacation rental performance data. VRM Intel’s first Data and Revenue Management (DARM) conference in 2019 marked a significant change in the industry’s reliance on and attitude toward data. In March 2020, vacation rental managers realized that access to comparative benchmark data is essential. The increasing use of data in important business decisions means data providers must reliably provide actionable and high-quality information. Using examples from around the United States, below are the new standards for vacation rental data.
1. Updated daily
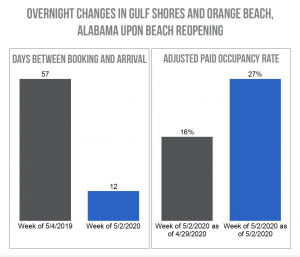
Until recently, hospitality data sets were reported on a weekly or monthly basis. But when travel advisories, local regulations, and renter sentiment change overnight, the five-day wait before your next data update seems like an eternity. One example is how quickly reservation activity for Gulf Shores and Orange Beach, Alabama, changed when the beaches reopened on May 1, 2020. New reservations immediately spiked for the following weekend. For the first weekend of May in 2019, the average time between a guest making a reservation and arriving was 57 days. For the same weekend in 2020, that window dropped to 12 days. This influx of bookings caused the weekend’s paid occupancy rate to increase by 11 percent in just three days.
When performance changes this quickly, you need up-to-date data as soon as you sit down at your desk in the morning.

2. Insight into actual occupancy rates
Old-school vacation rental revenue management tended to prioritize high occupancy rates. Now, most revenue managers have shifted to balancing the Big Three: occupancy, average daily rate (ADR), and revenue per available rental (RevPAR).
The pandemic also accelerated the need to have a deeper understanding of what “occupancy” means. Calendar occupancy shows how many nights are unavailable to book. What it fails to show, however, are the non-revenue-generating nights such as owner stays, nights blocked for maintenance, orphan nights between stays, or even cancellations.
During the pandemic, historically safe assumptions about how often a unit would be used by the owner, hold nights, or cancellations are no longer relevant.
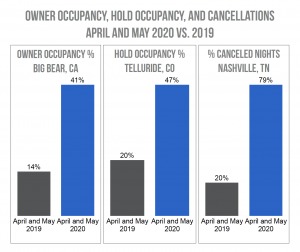
During April and May of 2020, the owner-occupancy rate in Big Bear, California, was 41 percent, up from 14 percent the previous year. Hold occupancy rates in Telluride, Colorado increased from 20 percent to 47 percent. The number of canceled nights in Nashville increased from 20 percent in 2019 to 79 percent in 2020.
If you intend to use market-level performance data to benchmark your inventory against your competitors or create revenue estimates for potential owners, make sure your data source considers the nuances of the overall occupancy rate.

3. Market segmentation
The past year has reminded us that just because one segment of the market is performing well does not mean that every segment is. As the perception of risk, group size and composition, and destination activities have evolved, the variation in performance between types of units has grown.
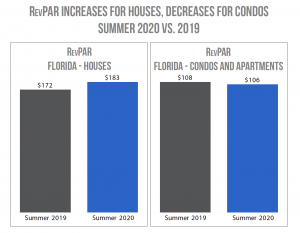
One of the most acute examples of performance differences in segments of the market can be seen between single-family homes and condominiums. During the early stages of the pandemic, booking activity for condos was much lower than for houses. Most likely, this was caused by renters assuming that single-family houses reduce the amount of contact with other people. In Florida, between June and July, RevPAR increased by 6 percent for houses and decreased by 2 percent for condos and apartments compared to the previous year. Overall statewide RevPAR increased by 3 percent.
If your inventory is primarily condos, looking at data for the entire market could lead to false expectations for your units’ performance and to poor revenue management decisions. Your data provider should give you the ability to look at market data by segment or even by custom competitive sets.

4. Hyperlocal data
Similar to performance differences between unit types, performance differences between markets have also increased. Local regulations, changes in travel preferences, and shifts in traveler activities have benefited some destinations while harming others. Even for similar markets within 20 miles of each other, year-over-year changes in performance vary considerably.
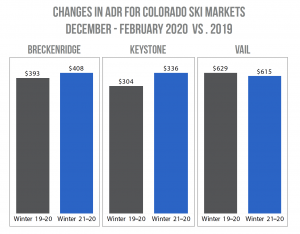
Breckenridge, Keystone, and Vail are all relatively close together in Colorado. However, their changes in ADR versus last year are quite different. For December through February, the ADR for rentals in Breckenridge was $15 higher than the prior year. Keystone increased even more, by $32. But in Vail, the ADR declined by $14. Although it might be tempting to group all three markets together (which would show an increase of $21 for the region), that would not reveal the dramatic differences between the destinations.
To help you stay competitive and make informed revenue management decisions, you should be able to track data at a number of different levels, including your own town or neighborhood.
As the vacation rental industry continues to become more sophisticated and make headlines, so should our expectations of our data providers. At a minimum, expect your reporting tools to include daily updates, insight into types of occupancy, market segmentation, and hyperlocal data. If they don’t, you won’t have the information you need to stay at the top of your game in an ever-changing environment.


