For many US vacation rental homeowners and managers, the 2021 summer season was likely the most profitable they have ever experienced. Although 2020’s summer performance varied greatly between destinations—luxury, drive-to leisure markets prospered while urban areas continued to struggle—Summer 2021 brought growth to almost every US destination.
In 2021, pricing power grew as demand surged, and rates increased accordingly. In the most popular leisure-based destinations, every canceled reservation was soon replaced by a new one.
As is always the case, the extent of growth varied by region and city. Whereas some key performance indicators (KPIs) —like occupancy and average daily rate (ADR)—followed similar trends across most of the country, other KPIs—like the average booking window—differed.
Let’s recap 2021’s summer season using data from professional property managers around the country. The following data sets represent approximately 391,000 properties managed by 2,360 vacation rental management companies.
Adjusted Paid Occupancy: June 1 – August 31
The adjusted paid occupancy rate (occupancy) measures the number of guest nights out of the nights not taken up by owners or holds.
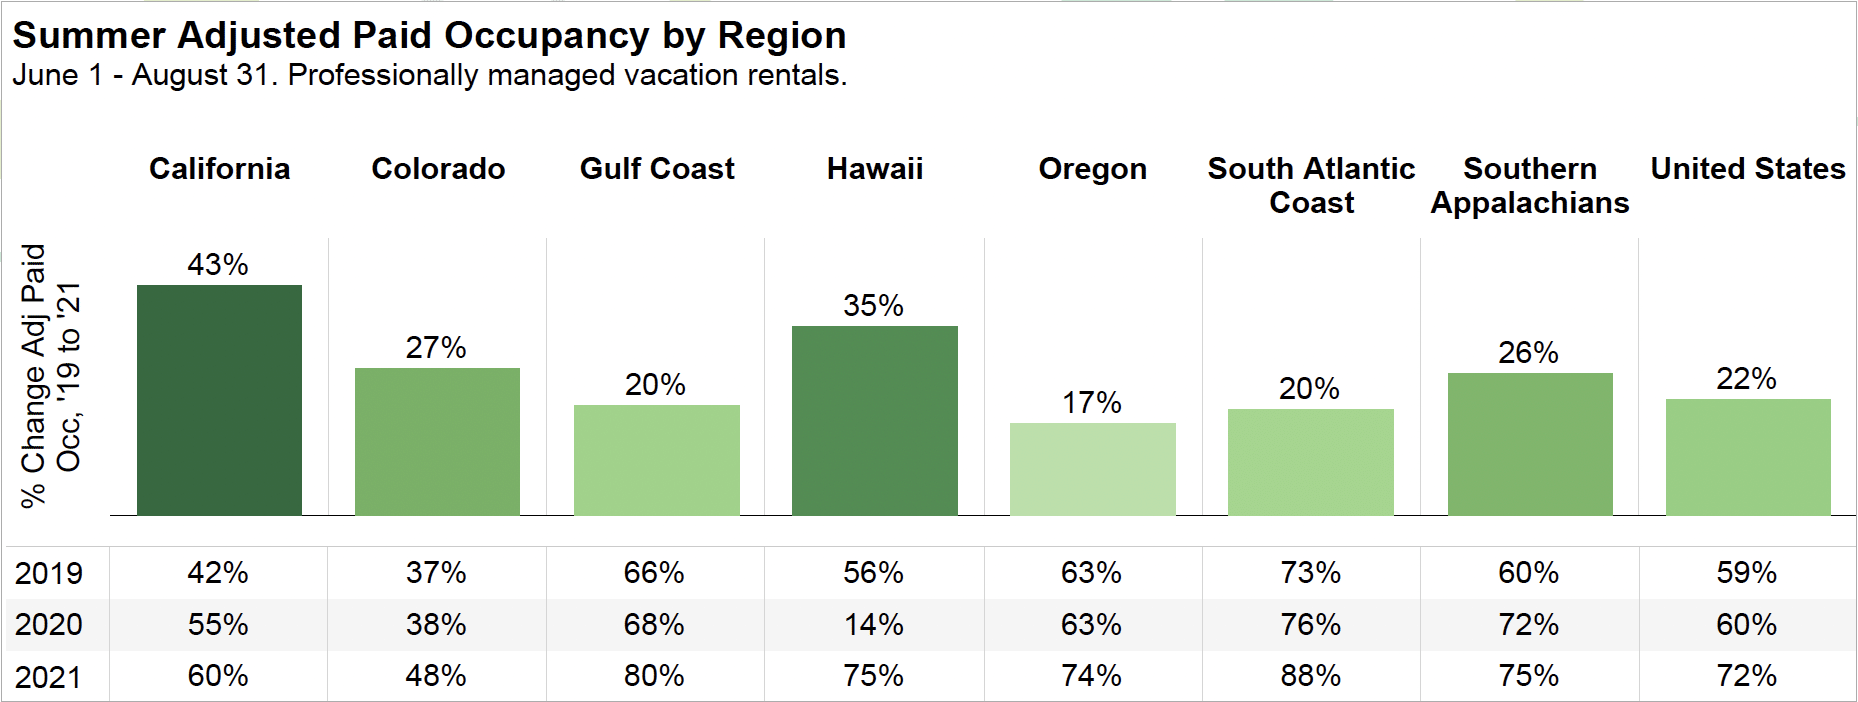
In the US, the national average increased by 22 percent between 2019 and 2021, and 2021’s summer’s occupancy rate was 72 percent.
Of the regions featured here, California experienced the largest increase at 43 percent. Even more exciting is the recovery and growth of rentals in Hawaii, where occupancy was extremely low last summer (2020).
Mountain destinations like those in Colorado (+27 percent) and the Southern Appalachian Mountains (+26 percent), a region that includes North Georgia, Western North Carolina, and the Tennessee Smokies, also performed well.
The Gulf and South Atlantic coastal markets saw slightly less year-over-year growth, but that is most likely a factor of summer occupancy usually being quite high in those regions.
The growth in the overall occupancy rate reflects the increase in demand for vacation rentals that has occurred in the last year and a half.
Average Daily Rate (ADR): June 1 – August 31
The increase of the average daily rate (ADR), which is the average rental revenue generated per guest night, has been one of the most astounding trends of the summer.
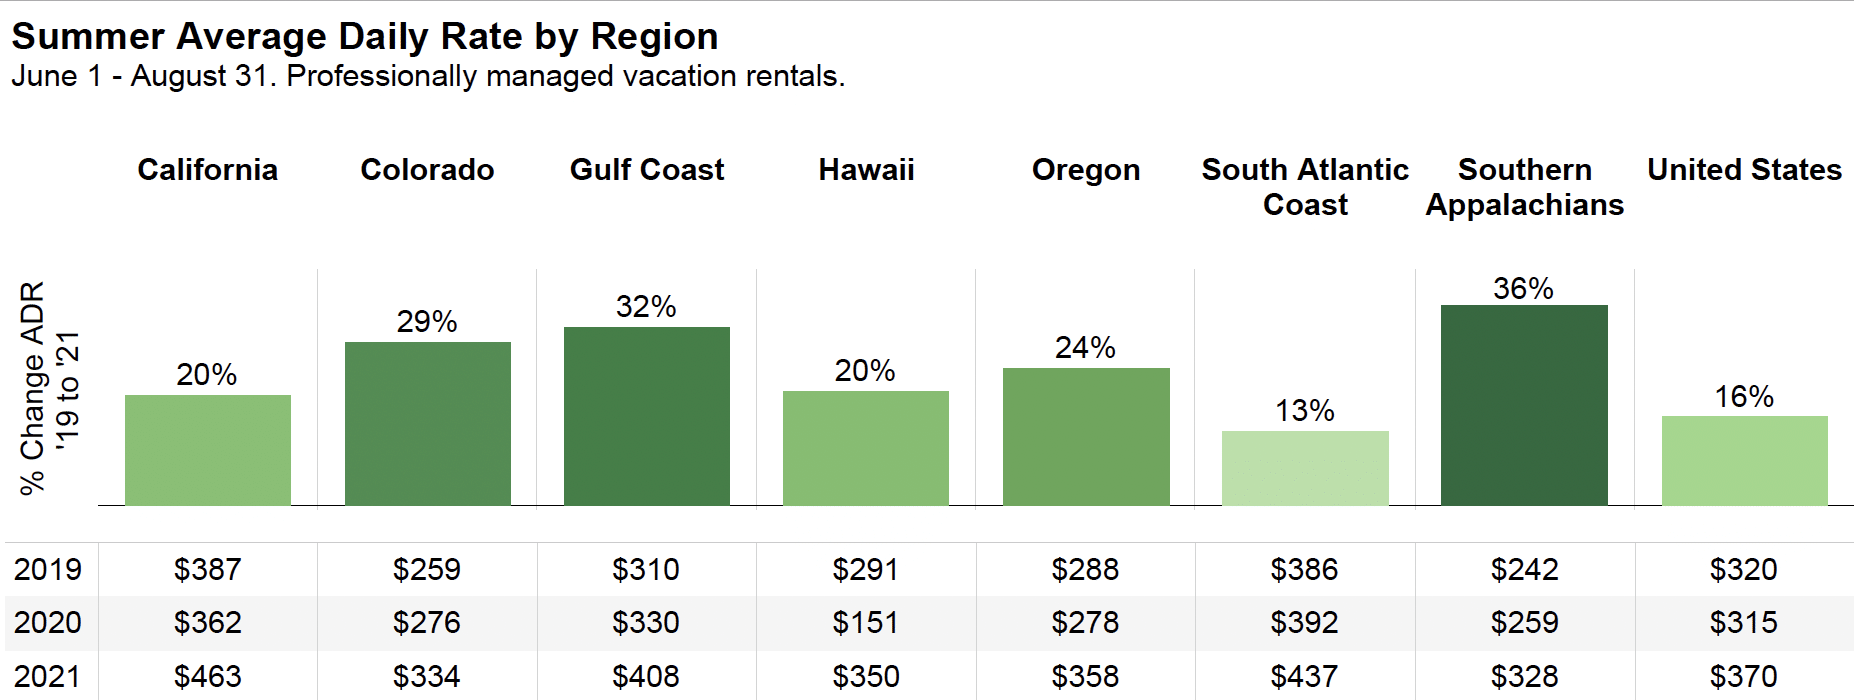
A variation of +/-5 percent in nationwide ADR can be considered normal. For example, between 2018 and 2019, the summer ADR increased by 2 percent. Amid the COVID recovery, the summer ADR fell by 2 percent from 2019 to 2020. But from summer 2019-which we use as our last “normal” year-to summer 2021, the nationwide ADR increased by 16 percent.
Although rates were almost uniformly higher than in 2019, the extent to which they increased varied.
The Southern Appalachian Mountains saw the largest year-over-year increase of 36 percent over 2019.
Their beach counterparts on the South Atlantic Coast, which stretches from the Florida Keys through North Carolina’s Outer Banks, experienced a more moderate increase of 13 percent.
In much of the country, vacation rental managers and hosts were able to capitalize on increased demand and raise their rates dramatically.
Adjusted RevPAR: June 1 – August 31
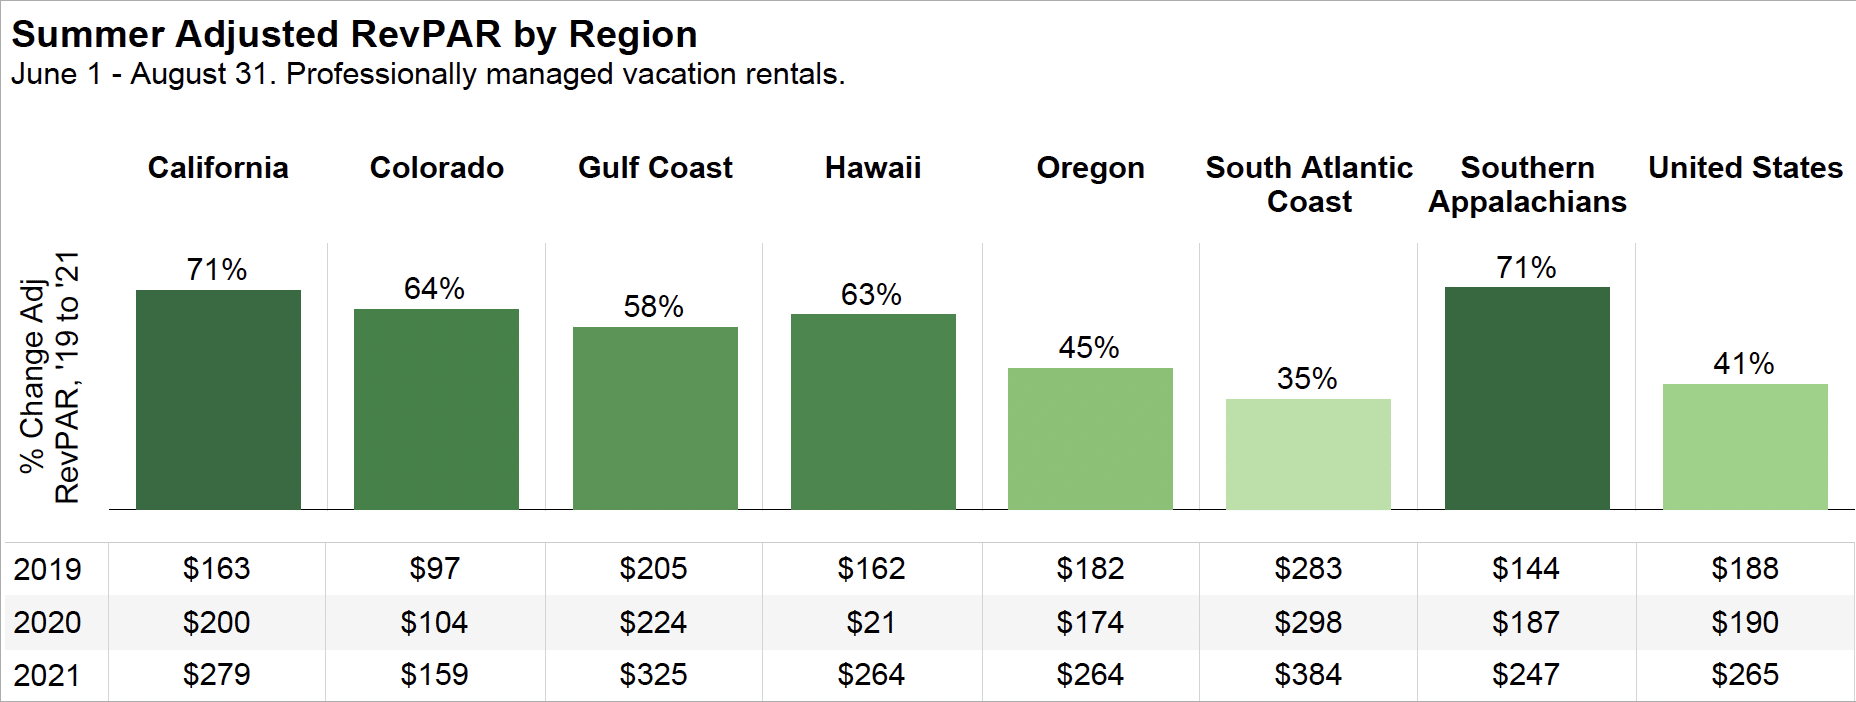
Due to the increases in both occupancy and rates, the average rental in the United States earned 41 percent more revenue this summer than in 2019. Adjusted revenue per available rental (RevPAR) combines occupancy and ADR to measure the average revenue earned per night not taken up by owners or holds.
California was the region with the highest growth in occupancy, whereas the Southern Appalachian Mountains had the largest increase in ADR; both ended the summer with an adjusted RevPAR 71 percent higher than in 2019.
The South Atlantic Coast was the lowest performer, despite having an impressive 35 percent increase. Increases in RevPAR should signal a positive future for markets like Hawaii and cities, where the recovery has been delayed.
Average Booking Window: June 1 – August 31
Although the rental performance indicators for most destinations around the country trended in similar directions, booking behavior has been less uniform.
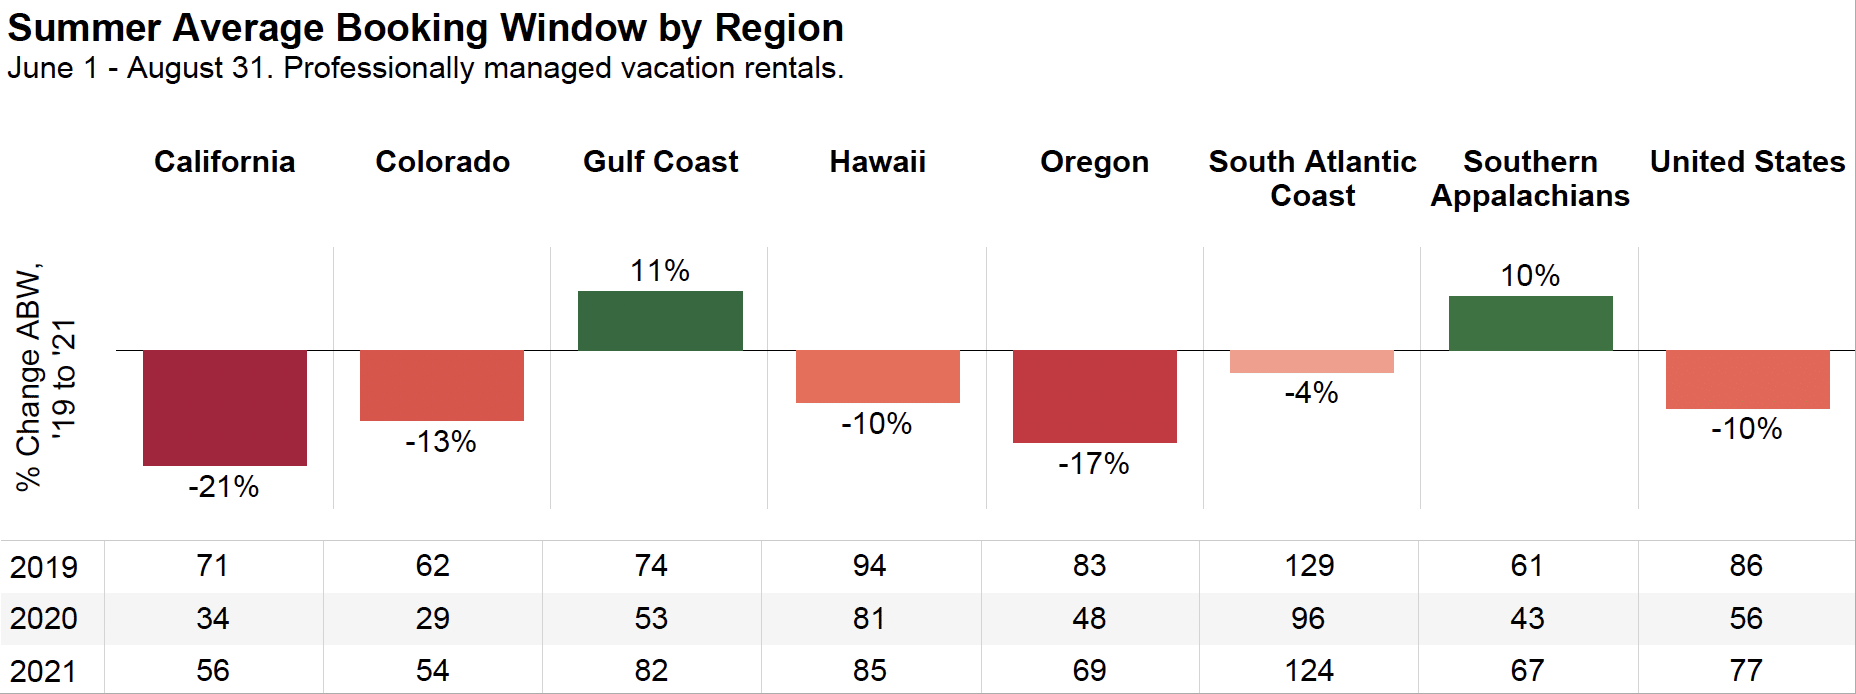
The average booking window, or the time between a guest making a reservation and arriving, decreased from 86 days in 2019 to 77 days in 2021. However, this is much closer to normal than the 56-day average booking window in 2020.
California and Oregon experienced the largest decreases in the average booking window, at -21 percent and -17 percent, respectively.
Interestingly, the Gulf Coast and Southern Appalachians had longer average booking windows in 2021, despite sharp decreases in 2020.
The shorter booking window has allowed revenue managers to keep prices set high until the travel date, but the average booking window is slowly returning to normal for most markets. Vacation rental managers will need to continue to stay on top of demand and booking data and adjust strategies accordingly.
Average Length of Stay: June 1 – August 31
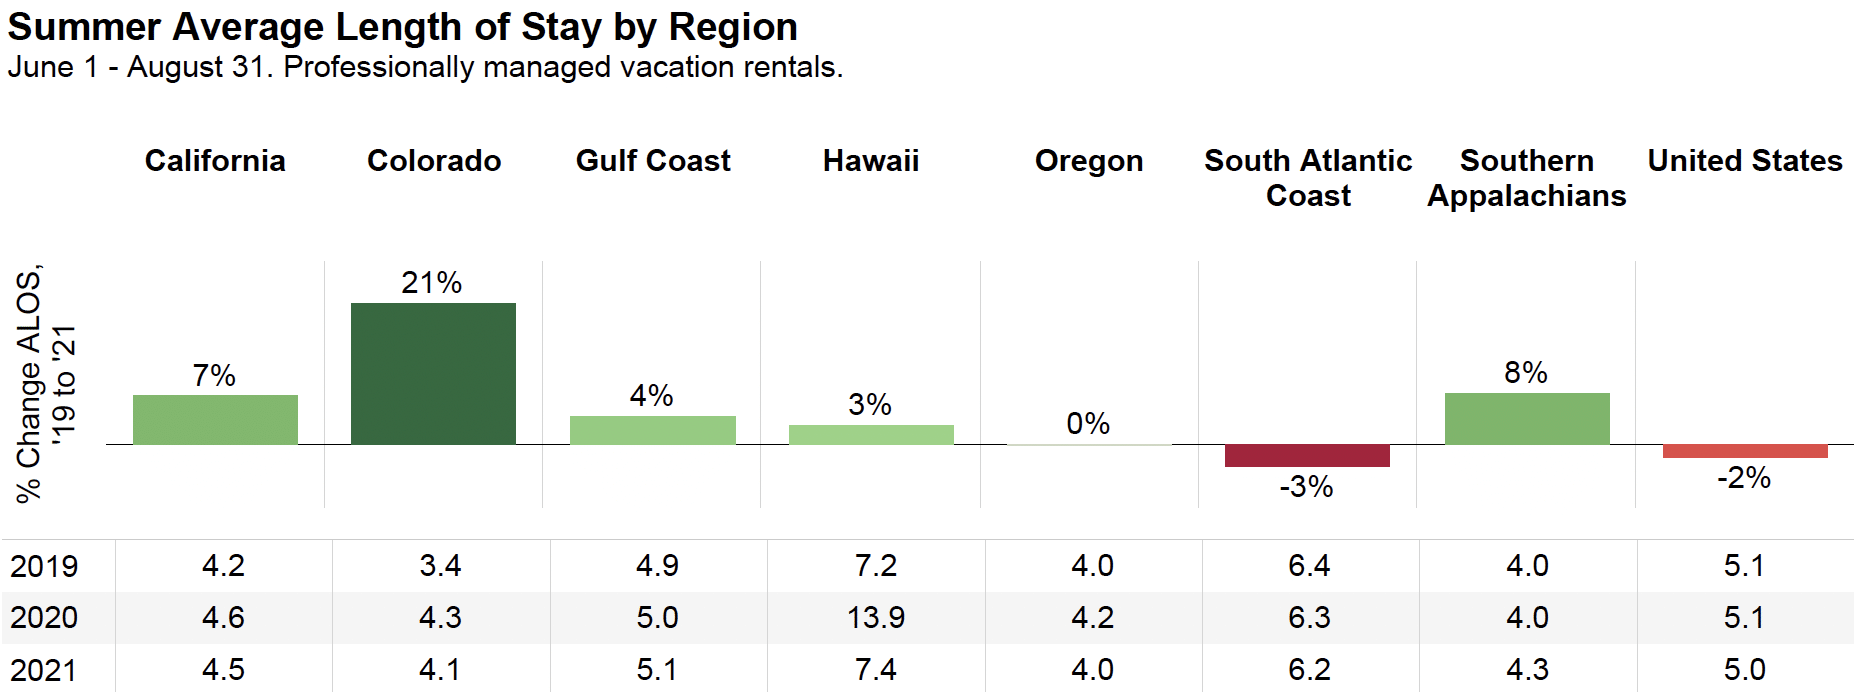
Nationwide, the average length of stay dropped from 5.1 days in 2019 to 5.0 in 2020.
With the exception of Hawaii, where the stay length almost doubled in 2020 due to travel restrictions, most markets have not seen significant changes in the average length of stay over the past two summers.
Colorado saw the largest change from 2019 at +21 percent, but this was still only a 0.7-day increase. These numbers imply that the average guest is taking the same length of trip they always have, although the average could smooth over the outliers.
41% Increase in US Rental Revenue
Taken together, these trends highlight just how remarkable the 2021 summer season was for rentals around the country. Hosts, homeowners, and property managers likely made it through very uncertain times last year by dreaming about the light at the end of the tunnel. The national 41 percent increase in revenue was an even brighter light than most of us expected.
However, the market is still in flux. As the pandemic drags on, regulatory battles heat up, and other lodging sectors recover, staying on top of the trends continues to be crucial for all involved in the vacation rental industry.

