
It is up to you to demonstrate your value to homeowners. By choosing the right metrics, educating your owners and providing consistent reporting, you can quickly earn their trust and loyalty.
There are two common—yet problematic—choices for metrics which you communicate to your homeowners: Occupancy Rate and Average Daily Rate.
Occupancy Rate is the percentage of nights you have rented. For example, if you rent out a unit for 20 nights in August, its occupancy rate is 65 percent for the month.
Average Daily Rate (ADR) is the average nightly price for which you rent out a unit. If you have two reservations for August, one for five nights at $123 per night, and the second for three nights at $179 per night, your average daily rate is $144 per night.
Your owners might have a sense for historical occupancy rates and average daily rates for each season. A common pitfall is to try to increase these values year over year, often at the encouragement of the owner.
But neither metric determines revenue, which is the measure of your business.
Increasing occupancy rates could lower revenue if you’re discounting too much to get those higher occupancy rates. And increasing average daily rates could lower revenue if you lose too many bookings because of your higher prices.
Why not just measure revenue? Because revenue does not account for owners stays. If last August you had 31 nights available to rent out, but this year the owner has reserved 14 of them, revenue will have decreased for the month, even if you have improved. Do measure total revenue, but do not make it your top metric when speaking with your owners.
The solution is Revenue Per Available Night (RevPAN). RevPAN is the amount of money you have collected each night that a property is available to rent out.
The hotel industry uses a similar term, Revenue Per Available Room (RevPAR). But as a vacation property often has multiple rooms, the hotel term is confusing.
In the vacation rental industry, it is optimal to stick with the RevPAN metric. You can measure the performance of a single property or your whole inventory, and you can easily compare this metric for the current year against the previous year(s) or this month against last month.
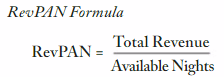
RevPAN Formula
What is an Available Night?
Available nights are all the nights you are allowed to rent out in a specified time period. Take the total number of nights for a given period and subtract the off-market nights. The most common off-market nights are owner stays.
Available Nights=Total Nights—Off-Market Nights.
Protip: Should you count “out of order” days? Typically, you should count changeover days as available. That’s the standard set by the hotel industry. But if a property is undergoing maintenance, marking those nights as off-market will help you communicate to the homeowner that you are not responsible for renting them out.
Example: Let’s calculate the number of available nights in May for a single property. “Total nights” is 31. The owner has reserved seven nights in May, and there will be roof repairs for two nights after that. The total number of off-market nights is nine. This leaves 22 available nights.
(31 Total Nights—9 Off-Market nights=22 Available Nights.)
What number should I use for Revenue?
You are demonstrating your value to your owners, so only include rental revenue (the rental revenue that you use to calculate your commission). Exclude additional guest fees that you keep (i.e. cleaning, pool heating and pets).
Example: Let’s go back to the May example above, with 22 available nights. We’ve gotten three reservations for the month:
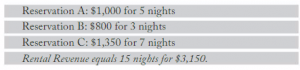
Protip: When calculating your RevPAN for your owners, you should not include additional guest fees. But when you’re calculating it for your business, you should. These fees are an important part of your company’s revenue.
How do you calculate RevPAN?
Here’s the formula again:
RevPAN equals Rental Revenue divided by Available Nights.
Continuing with our example, we have $3,150 in rental revenue and 22 available nights, so RevPAN is $143 per night.
Let’s compare that against average daily rate, which is $210. RevPAN is significantly more useful because it combines both average daily rate and occupancy rate. It is a more comprehensive and indicative metric of your company’s performance, and unlike the total revenue for the month, you’re not penalized for the nine off-market nights.
Reporting RevPAN to a Homeowner
When we bring on a new customer at Smart Host, the first thing we do is send them a revenue report. It includes RevPAN, Occupancy Rate, Average Daily Rate and Total Revenue. Break out those metrics both monthly and annually to establish a baseline.
Each month, compare your performance to the previous year’s numbers, typically as a year-over-year percentage change.
Using our example, let’s say the previous year’s May RevPAN was $122 per night. We would report that May 2016 RevPAN is $143 per night and has a 17% year-over-year increase.
Now, let’s fill out a few more details of our example to see why RevPAN is the best performance metric.
Example:
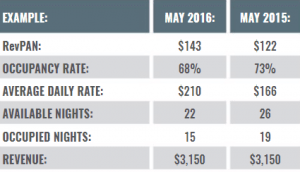
Was 2016 an improvement over 2015? Yes! The manager was more effective.
Even though they had four fewer available nights available to rent, they earned the same revenue. This win is reflected in the RevPAN growth of 17 percent.
It is much more difficult to see this positive change by looking at Occupancy Rate and Average Daily Rate alone. Did ADR go up by enough to make up for the decrease in occupancy rate? You’d have to compare percentages to find out. Instead, just look at RevPAN.
As a vacation rental manager, there are many variables you don’t control: owner stays, weather, repairs and travel trends. As you respond to these variations, many metrics—occupancy rates, average daily rates, total revenue—will only hide the success of your work.
Make RevPAN the first metric your team uses to demonstrate performance. You’ll make more money and your homeowners will know it.