The past few years have been extremely tumultuous for ski destinations in the Western United States. COVID-19 regulations, changing traveler trends, and dependence on mother nature to deliver snow have made it hard to predict trends for ski destinations.
Additionally, performance differences between condominiums and houses have continued to evolve, and nowhere is that relationship more relevant than in ski markets. Unlike many leisure markets in the U.S., where inventory is heavily skewed towards a single property type, ski markets tend to have a much more even spread of condos and houses. Because of this, understanding the dynamics of pricing and occupancy across unit types is especially important for vacation rental managers or hosts in ski destinations.
Paid Occupancy Rate(s)
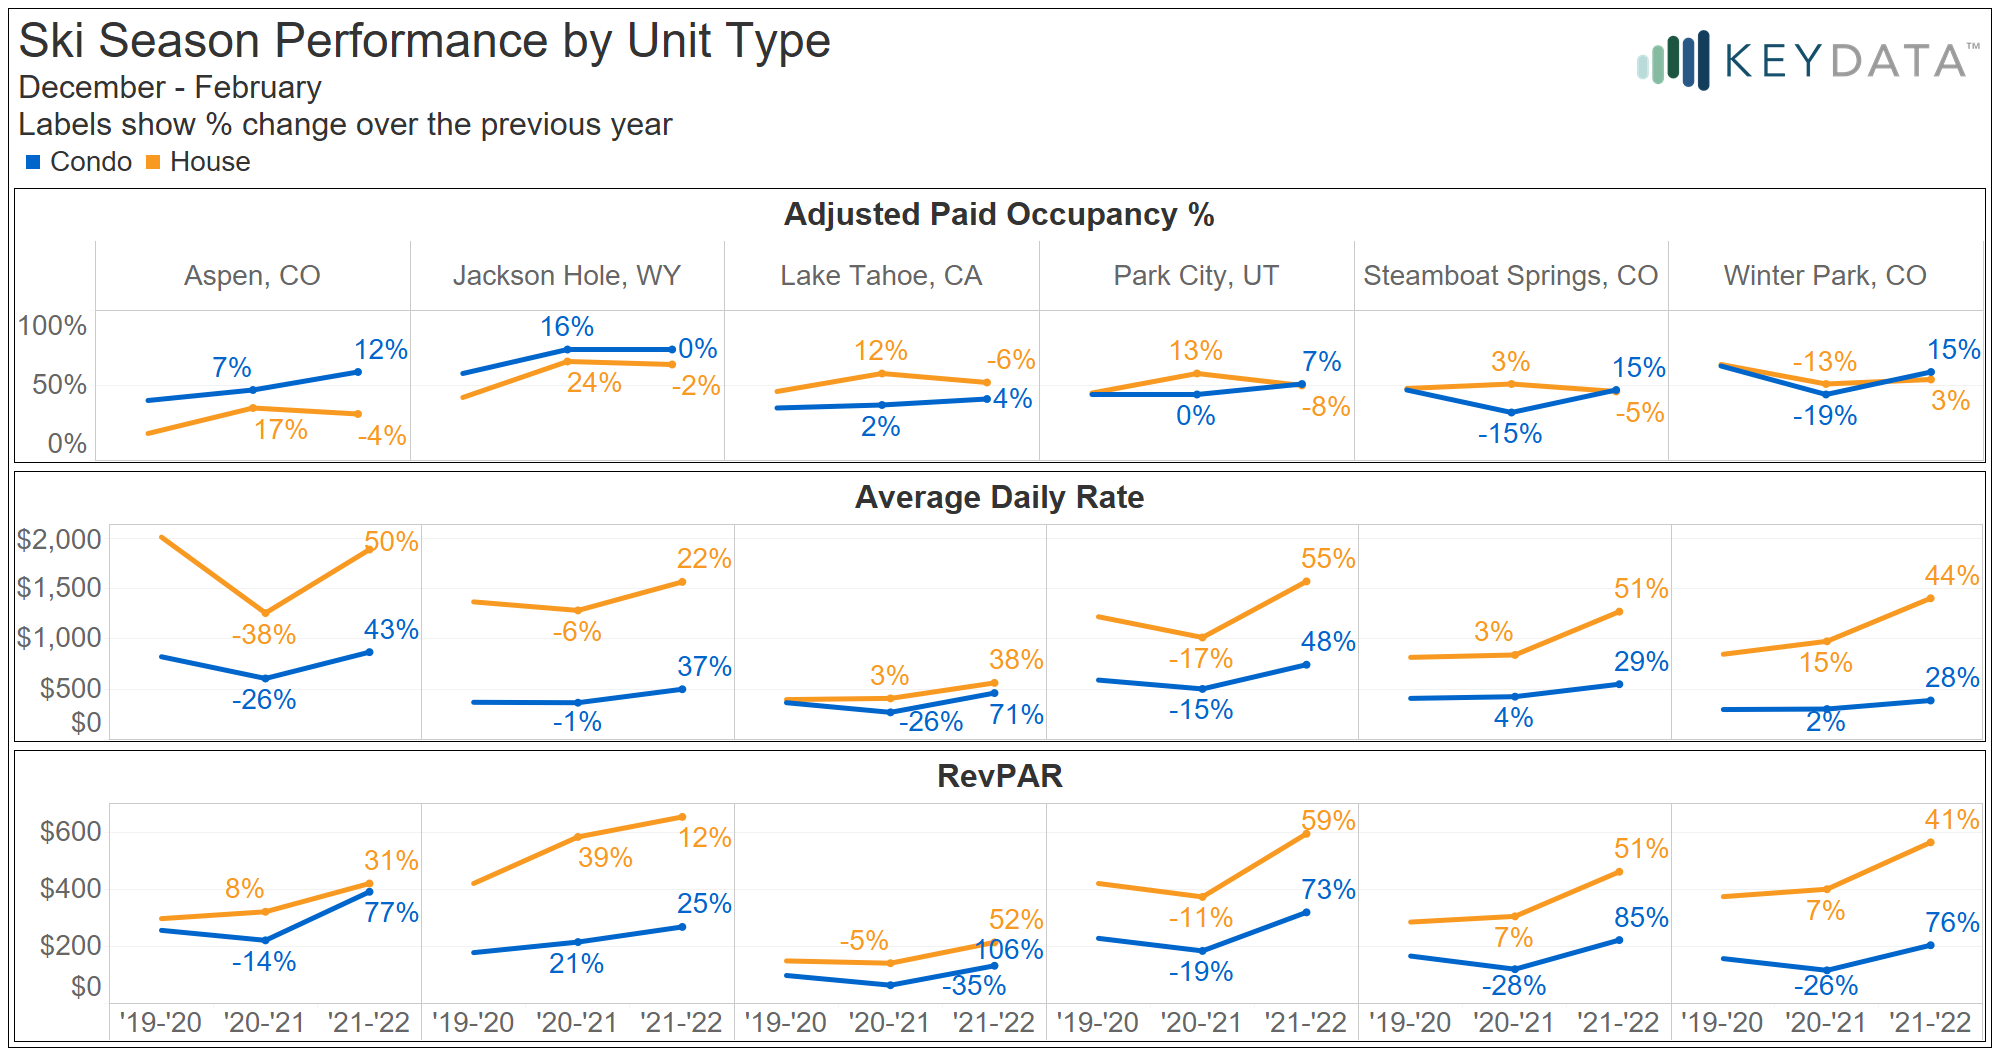
Compared to last season, most Western United States ski markets experienced moderate increases in the adjusted paid occupancy rate, which is the percentage of guest nights out of the nights available for guests to book.
However, considering only the market-level change overlooks the more interesting changes in occupancy by unit type. In each of these six markets, occupancy rates for condos increased at a greater rate than occupancy for houses and in some, condo occupancy overtook house occupancy. For some markets, this could be due in part to a return to normal booking behavior.
Last season, houses were more popular and saw increased occupancy rates while condos saw more moderate increases or decreases in occupancy. However, nightly rates have likely been a deciding factor in renting a condo versus a house.
Average Daily Rate(s)
Around the United States, many markets have experienced extreme fluctuations in average daily rates (ADRs) for vacation rentals in the last two years as managers have tried to compensate for decreased or increased demand. During the ’20/’21 ski season, changes in ADR from the previous season were relatively inconsistent; rates, as well as the difference in rates across property types, decreased in some markets and increased in others. Since last season, ADRs have increased in all markets for both property types but the extent varied.
While some of the increase was likely a correction for decreases in rates last year, most markets have still seen large increases over the ’19/’20 season.

The relationship between average daily rates and occupancy can be difficult to understand because of its bi-directional nature. Prices influence potential renters’ decisions, and thus occupancy, while managers change prices in response to occupancy pacing and forecasts.
Last season, houses performed better with regards to occupancy in each market.
While the narrative has often been that renters have preferred houses over condos due to perceived safety during the pandemic, there are key signs that pricing in ski markets influenced whether renters choose a house or a condo.
In Aspen, Jackson Hole, and Park City, the difference in rates between houses and condos was greatly reduced. In Aspen, for example, the average daily rate fell dramatically for houses, decreasing the pricing differential for houses versus condos from $1,190 in ’19/’20 to $650 in ’20/’21, and occupancy for houses increased by 17%. These changes made renting a house a more attractive option than during a normal year.
This season, the adjusted paid occupancy rate for houses decreased in every market but one. However, average daily rates increased for houses in each market, often by 40% or more. In Aspen, the difference in ADRs between houses and condos increased to $1,021 and house occupancy decreased by 4% while condo occupancy increased by 12%. In Winter Park, the gap between the average house and the average condo increased substantially, from $674 last season to $1,017 this season, and condo occupancy went up by 15%, compared to 3% for houses. Similar trends can be seen in Steamboat Springs and Park City. Nightly rates for houses seem to have increased to a point where some renters are opting for a condo instead.
RevPAR
Of course, sacrificing a few reservations can be worth it when nightly rates have increased this dramatically. Adjusted revenue per available rental (adjusted RevPAR) measures the average revenue generated per night available to be booked and is a better indicator of impact to the bottom line.
The large increases in rates for houses compensated for decreased occupancy and pushed adjusted RevPAR upward, which means losing some reservations to condos did not hurt the bottom line. However, year-over-year increases in adjusted RevPAR were much higher for condos than houses. As nightly rates continue to increase, revenue managers will need to be careful to not raise prices on houses so much that the increased rates do not offset decreased occupancy.

The past few years for the vacation rental industry have been challenging. A global pandemic and travel restrictions that vary by country and state have rendered some typical trends and patterns almost obsolete.
Ski markets have found themselves at the center of the changes and provide valuable insight into the impacts of price, unit type, and market on vacation rental performance.


And all this analysis will face a huge curveball as more locales face STR restrictions limiting supply of properties and or annual caps of nights rented. It will be interesting to watch as supply becomes constrained will Occupancy, ADR, and RevPAR all increase such that supply and demand are perfectly matched? Let’s remember that all local businesses are likely now also participating in the increased occupancy as local spending also increases, they should be happy as well.