While the concept has taken time to catch on, vacation rental managers and DMOs are beginning to value and utilize comparative data platforms that provide source data originating directly from property management systems. Until recently, benchmark data platforms only provided self-reported data from property managers or “scraped” data displaying data points from third-party websites such as Airbnb and Vrbo. Now, with source benchmark data platforms through which data are compiled and aggregated in an apples-to-apples manner, the vacation rental industry is beginning to get a clearer picture of actual performance over time.
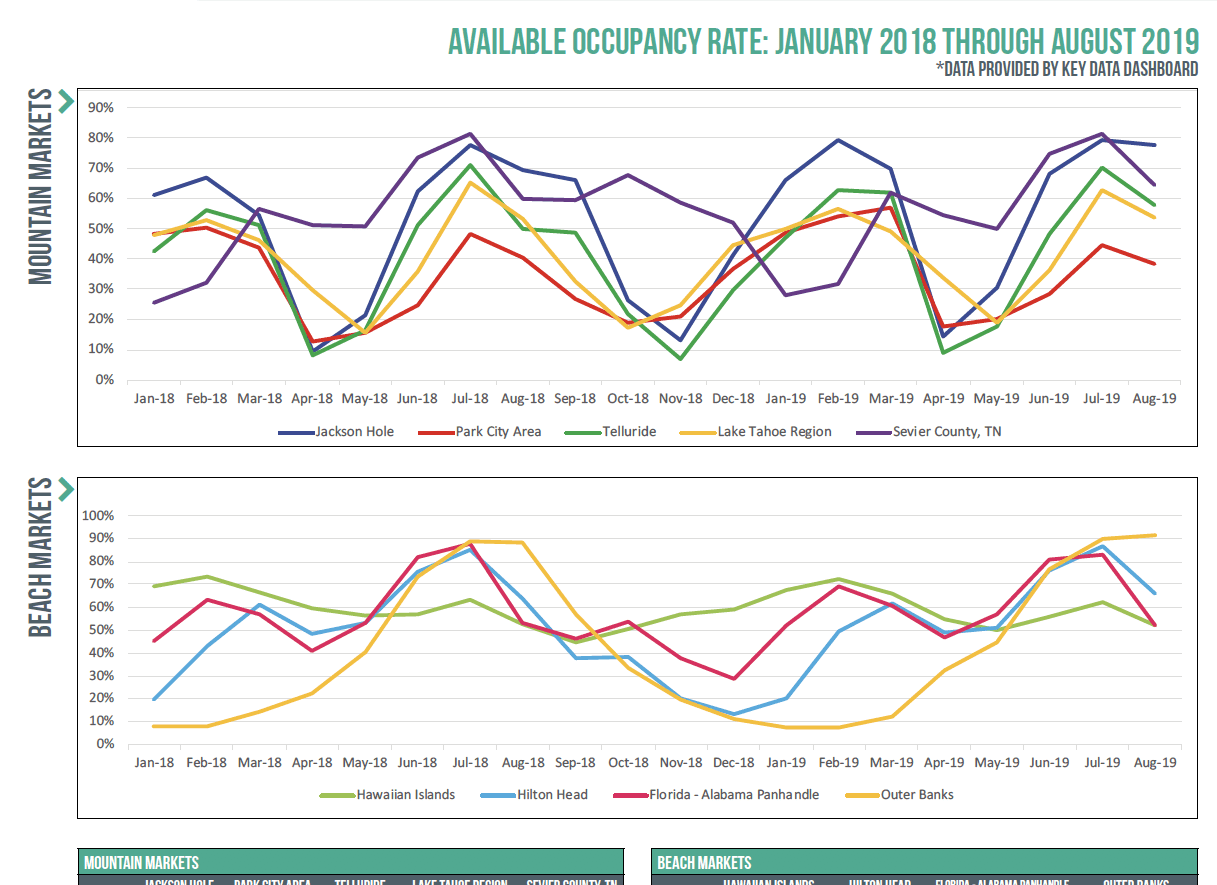
The data and KPIs displayed were provided in partnership with Key Data Dashboard and provide a look at the average daily rate (ADR), available occupancy, average length of stay, and average booking window.
We pulled together data a few key markets, including:
- Mountain markets (Jackson Hole, Park City, Telluride, the Lake Tahoe region, and the Gatlinburg area)
- Beach markets (Hawaiian Islands, Hilton Head, the Florida– Alabama Panhandle, and North Carolina’s Outer Banks)
- Charleston, SC
- Orlando, FL
As you comb through these KPIs, some interesting points jump out.
Across markets, ADRs are generally higher in 2019 than in 2018 with a few interesting exceptions. The ADR in April 2019 was lower across all the mountain markets we examined. However, in April, occupancy in these same mountain markets was considerably higher, averaging 25 percent across the markets.
In the stateside beach markets (Hilton Head, the Florida–Alabama Panhandle, and the Outer Banks), March brought a drop in ADR and an increase in available occupancy for Hilton Head and the panhandle, but the Outer Banks still saw a 14 percent decline in available occupancy.
We often hear industry experts say, “Stays are shorter, and guests are booking more last minute.” But are they?
As we look at the average length of stay and the average booking window over the past 18 months, that theory starts to fall apart. In the mountain markets the average length of stay was either higher or the same year over year with a few exceptions. Jackson Hole saw a slightly lower length of stay in the winter, whereas Park City and the Lake Tahoe region experienced a more significant drop in stay length in the summer.
In the beach markets, the average stay length was also either higher or flat over 2018 with the exception of the Outer Banks, which saw a notable year-over-year drop in length of stay from January through April. Looking at the booking window, while there are mixed results among destinations and across seasons, when we look across markets, the average booking window did not change significantly year over year—with a handful of exceptions in 2019; in Telluride in January (down 28 percent), in Park City in April and May (down 27 and 37 percent), and Lake Tahoe in January (down 25 percent). In all these cases, available occupancy during these months was up 9 to 39 percent.
NOTE: if you hover over the image, you can scroll through and zoom in on all the data presented.
[su_image_carousel source=”media: 20149, 20148, 20147, 20146″ limit=”1″ slides_style=”photo” controls_style=”dark” crop=”none” columns=”1″ adaptive=”yes” spacing=”yes” align=”center” max_width=”75%” captions=”no” arrows=”yes” dots=”yes” link=”image” target=”blank” autoplay=”5″ speed=”medium” image_size=”large” outline=”yes” class=””]
Now that we are seeing actual aggregated transactional data coming directly from professional property managers, we are able to challenge theories and analyze actual performance locally, nationally, and soon globally, to better understand vacation rental performance.


