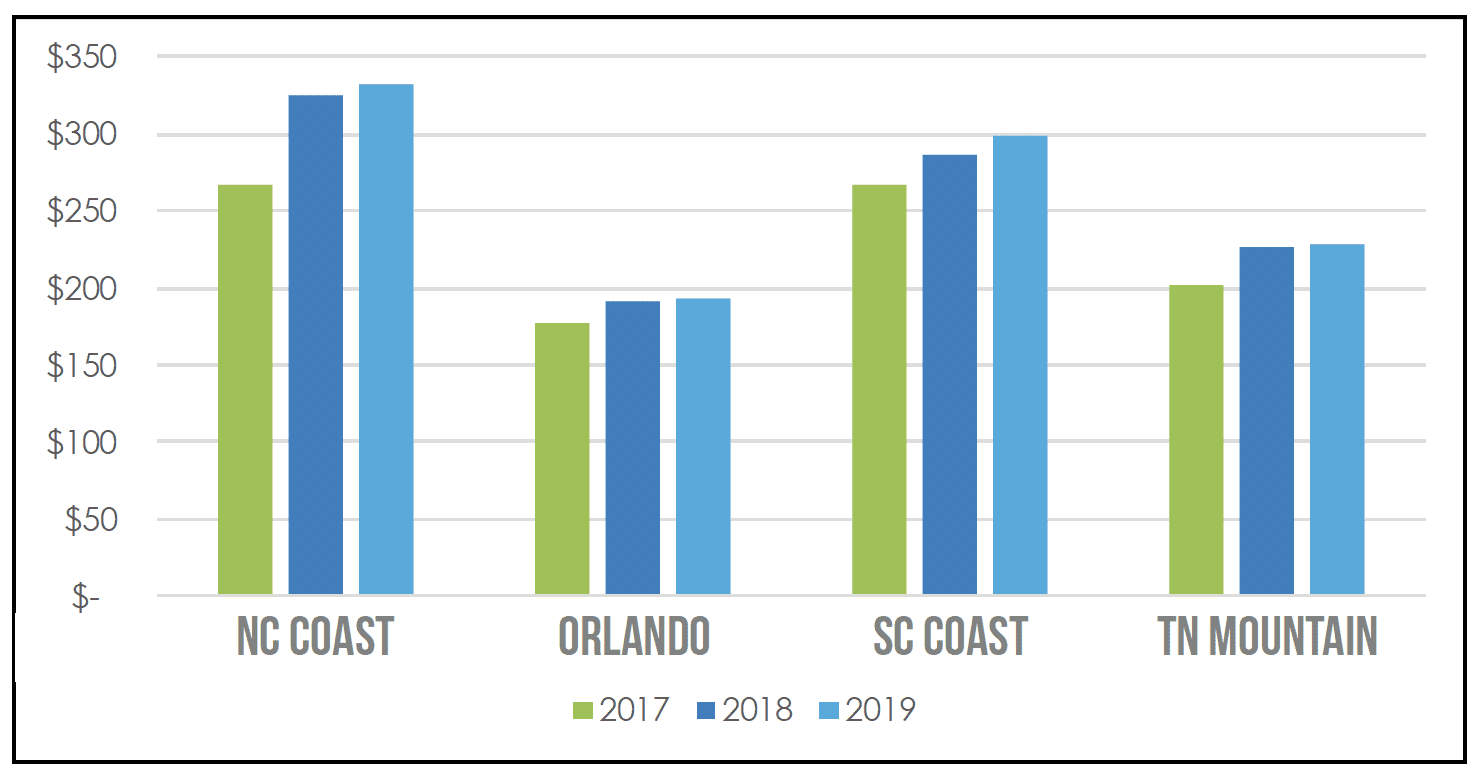
Now that vacation rental managers and destinations are contributing source data, we are beginning to get a factual view of actual performance over the past three years.
The following key performance indicators (KPIs) were provided by Key Data Dashboard and represent data compiled from 12 key vacation rental markets through December 31, 2019. It is important to note that Key Data Dashboard obtains information directly from property management systems instead of compiling self-reported data or data scraped from OTA calendars.
Reviewing annual data allows us to identify year-over-year trends in booking activity. For example, contrary to what we’ve been told, the average length of stay (ALOS) across these markets has seen little change over the past three years, but it is also not increasing in any of the markets we analyzed.
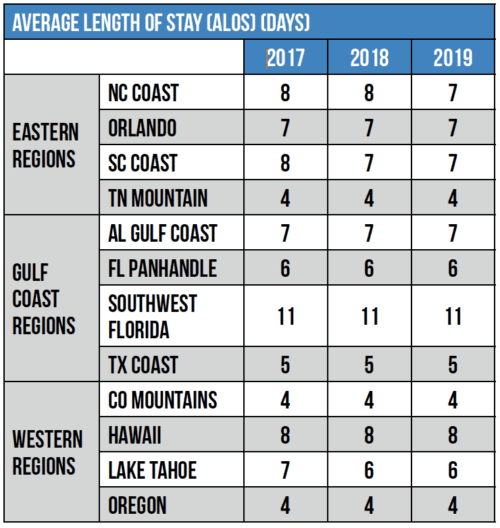
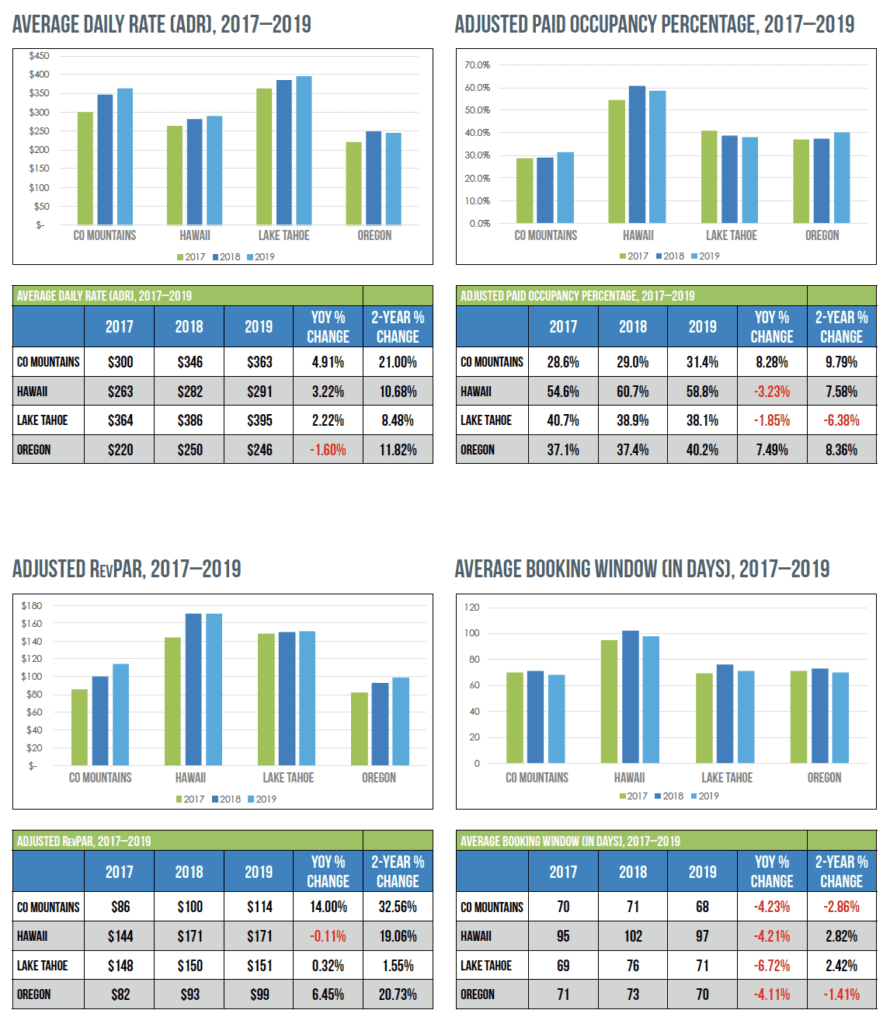
In addition, as you review the average booking window (the number of days between the date the reservation was made and the date of arrival), you will see that the Western regions and Southwest Florida saw a moderate decline in the average booking window, while the other markets experienced guests booking further out on average.
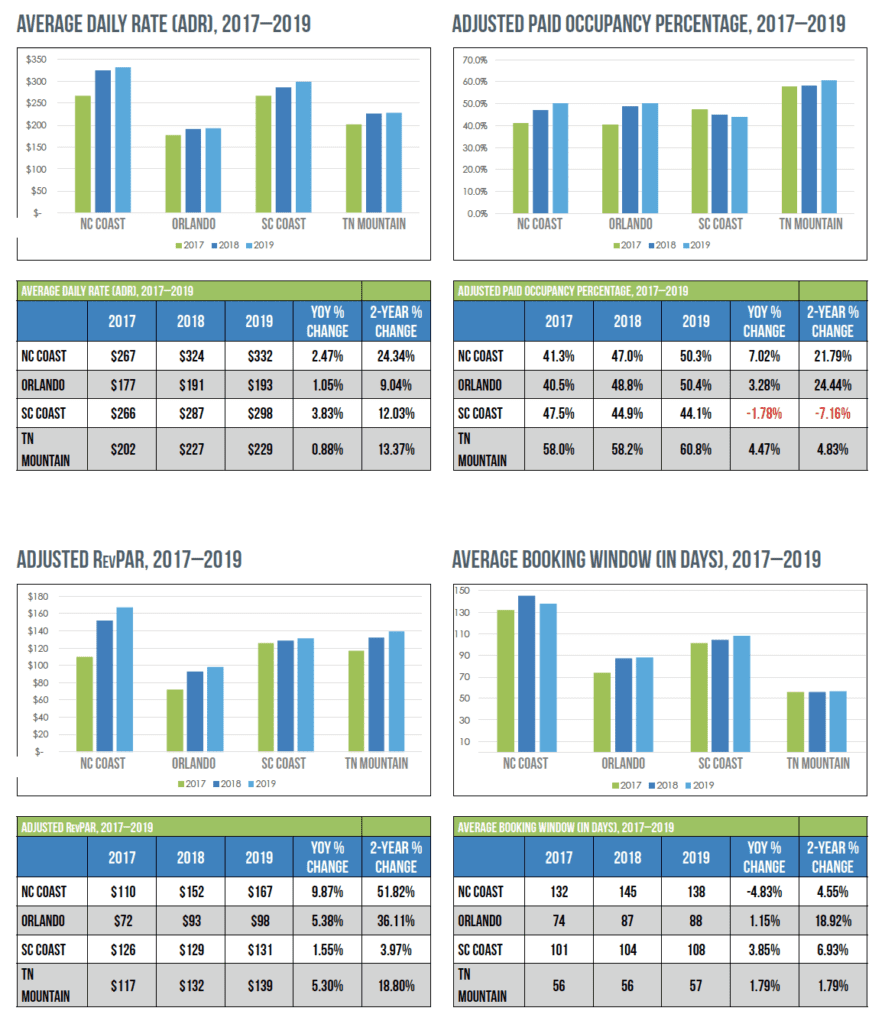
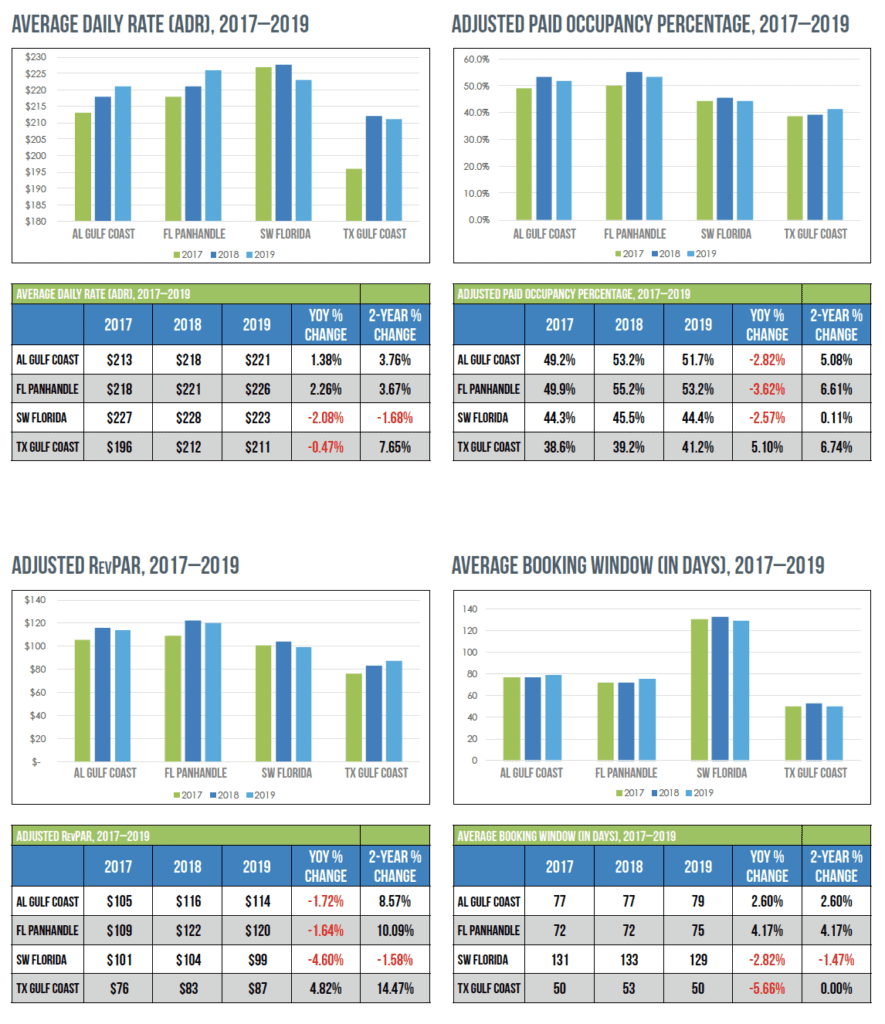
In the following pages, we have used adjusted occupancy and RevPAR KPIs. As you read in the fall issue of VRM Intel Magazine, the adjusted paid occupancy percentage accounts for owner stays and maintenance holds, considering only nights available to guests. Although the traditional occupancy rate may be an additional helpful KPI to compare, the adjusted paid occupancy percentage allows property managers to view occupancy from an angle that excludes factors beyond their control. Because the rates of owner stays and maintenance holds vary greatly from property to property, the adjusted paid occupancy percentage is useful for comparing similar inventories and is essential when benchmarking performance against competitors.
When calculated using adjusted paid occupancy percentage, adjusted RevPAR becomes a vacation rental-specific KPI. A critical KPI for measuring revenue performance, adjusted RevPAR accounts for both average daily rate and the paid occupancy percentage.
At the upcoming VRM Intel Live events and the Data and Revenue Management Conference, we will take a deeper dive into year-over-year reservation activity and booking pace in 2020.
*Data provided by Key Data Dashboard
Eastern Regions, 3-Year Performance
North Carolina Coast, Orlando, South Carolina Coast, and Tennessee Mountains
Gulf Coast Regions, 3-Year Performance
Alabama Gulf Coast, Florida Panhandle, Southwest Florida, and Texas Gulf Coast
Western Regions, 3-Year Performance
Colorado Mountains, Hawaiian Islands, Lake Tahoe Region, and Oregon




RSS