Data. Analytics. Conversions. Oh My!
If you are walking precariously along the yellow brick road of vacation rental marketing, these words are as scary as the unseen dangers hidden in the woods of Oz.
Data, analytics, and conversions require forethought, measurement, analysis, and strategy.
These concepts are probably more important to your vacation rental business than any other—except of course, the number: How much am I making?
And, just like in The Wizard of Oz, once you get to know what’s hiding in the trees, it’s much easier to navigate knowing that on the other side lie sunny skies, rainbow ponies, and a full rental calendar.
To put it more clearly, when you start to set marketing goals based on data and make marketing decisions based on trends in your data, you’ll see an improvement in the numbers you care about—bookings and revenue.
You may already be thinking, “This is too much for me,” but it isn’t, I promise! Just a little knowledge goes a long way, and sometimes just seeing what is hidden in the numbers is enough to give you an idea of some simple changes that could make big improvements. Using data tools such as Google Analytics, you can get a snapshot of key data points today and then watch over time as you make changes to your website and marketing efforts.
If you are like most online business owners, when your website is ready, you have your website person set up your Google Analytics account. You log in once or twice. Look at it. Click a tab or two. Close it. And forget all about it.
Or, you may find a couple of reports you feel are useful, like traffic channels, and you watch the numbers go up and down.
However, there are a few Google Analytics reports that can give you actionable information to help you quickly and easily see problems.
Be sure to look at these reports over a longer time frame by changing the date range in the upper-right-hand corner of your screen. Look at three or six months, or more if this is your first time viewing the data. After you start making changes, you’ll want to look at more recent time periods.
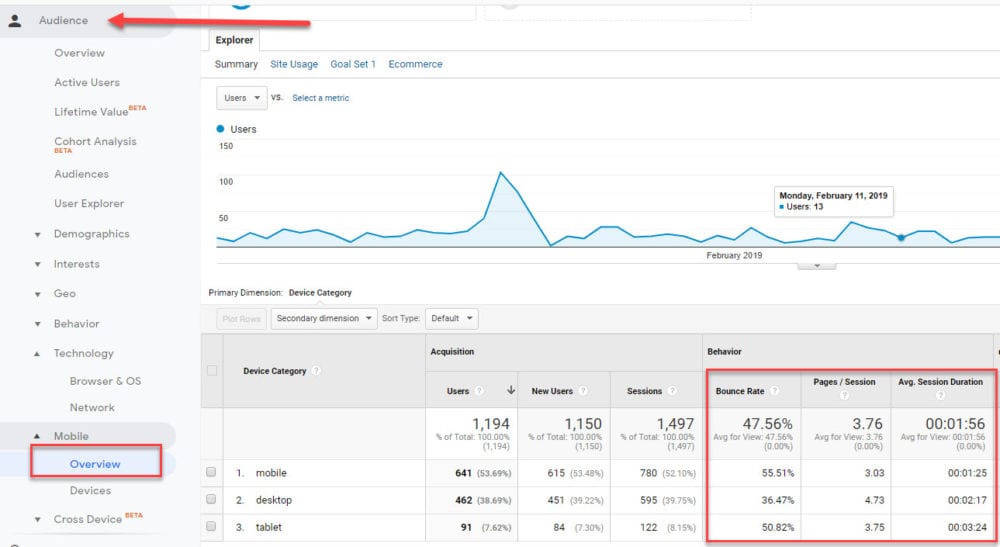
1. Audience Report —> Mobile Overview

This report shows you the number of users who used various devices to view your site and, overall, how they behaved on your site on each device. The bounce rate indicates what percentage of users left your site without any further action. A high bounce rate means a higher percentage of your users leave your site without engaging with your content.
Action items:
If your bounce rate is higher on mobile than on desktop devices, you need to determine why and make changes to your site now to help your users consume the content more easily on mobile. Use Google’s mobile-first tool and check a few pages; check your site speed via Pingdom, and learn more about how to segment traffic by device in Google Analytics so you can dive into how specific pages are performing.
2. Acquisition Reports —> Search Console
If you are working hard at ensuring your site is optimized for search engines or if you want to start implementing an SEO plan, you will definitely want to view this report and keep track of your performance. Note that if you do not see any data here, you need to add your Google Search Console data to the Google Analytics property. If you already have the search console, this is easy to do. If not, you will need to sign up for it first. The data will take a while to populate.
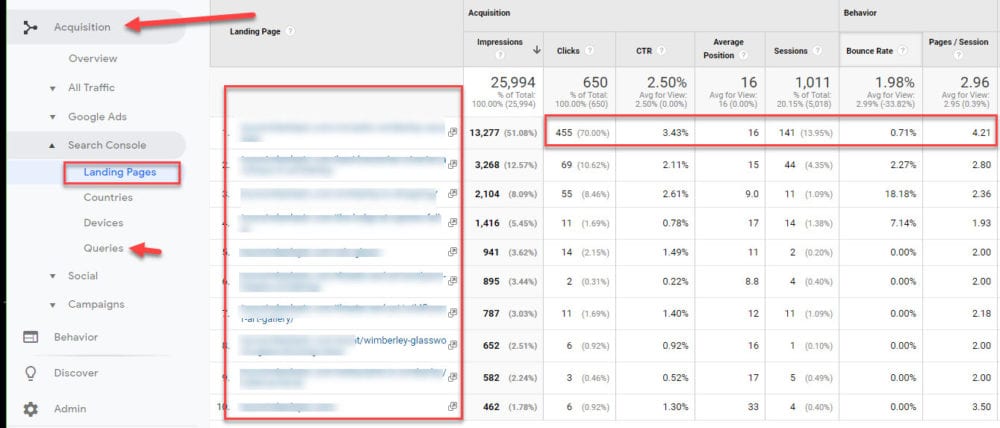
This report shows you which pages of your website are getting the most views from Google’s organic search. You can see how many times each page was included in the search results for the terms, how many times your page was clicked on, and the average results position (rank) at which your page is located for the search term. The report also shows your bounce rate and pages per session as well as goal completions if you have conversion goals set up.
You then can drop to the queries report, just three tabs lower in the acquisition report, to see some of the top queries through which users are finding your site.

In the example above, you can see that the top landing page (a blog post) received 455 page views and had a very low bounce rate. An average of 4.2 pages were viewed per session.
Action items:
To rise in Google’s rankings, you need to have great content that engages your users, so bounce rate is important. Work on making the content on your top pages more engaging so that people will read it and scroll down to look at images or videos. You also want to make sure the content on the page reflects what users are searching for.
If your property or booking pages are getting a high click-through rate but have a high bounce rate, this will directly affect revenue. Investigate to see what issues could be causing the problem. Is the page taking too long to load? Does your booking form load properly? Does your page’s meta description (Google Snippet) match the content on the page?
If bounce rate is low and page views per session are also low, you need to look at changing your navigation on your website or creating more links to additional content on the site to encourage visitors to investigate further. In the example above, 4.2 pages per session is great. This page actually leads people to additional resources on the site, including a booking page. It is responsible for nearly half of this client’s direct bookings per year.
3. Acquisition Reports All Traffic —> Channels & Source/Medium
The channels and source/medium reports are good overview reports on how your marketing efforts are working to bring traffic to your website. As you look at these reports over time, you need to watch how your traffic increases in relation to your bookings. If your site is working to convert bookings, as your traffic increases, your bookings should increase, too. If that is not the case, there are most likely issues on your website that need to be addressed before you start changing marketing tactics, because the point of marketing is to bring more visitors to your site.
The channels give you an overview of the sources of traffic to your site. You can create your own channels to add to this list and see them in your reports. Be sure and click on each to see a breakdown of social media and referrals. Note that there could be a bit of fake data in the referrals report unless you have set up filters, so don’t be alarmed if you see weird websites sending you a few users.

Questions to ask:
- What is your biggest source of traffic right now?
- What is the bounce rate, page view figures, and time on page for each source of traffic?
- From what social media sites are you getting traffic? Any surprises?
- Are you getting referrals from the listing sites or CVB sites on which you are paying to appear?
- If you have set up goals, how do conversion rates differ among the channels?
The source medium report breaks down the channels report and is especially useful for comparing all sources of traffic at once.
As you get more experienced at tracking your traffic and start using many different sources to get traffic to your site, you may want to use UTMs to tag your traffic from each specific ad, post, email, and so on. A UTM code is a simple code that you can attach to a custom URL in order to track a source, medium, and campaign name. This enables Google Analytics to tell you where searchers came from as well as what campaign directed them to you. I encourage you to learn more about UTMs, especially if you are using any type of external advertising.
4. Google Analytics Behavior Reports
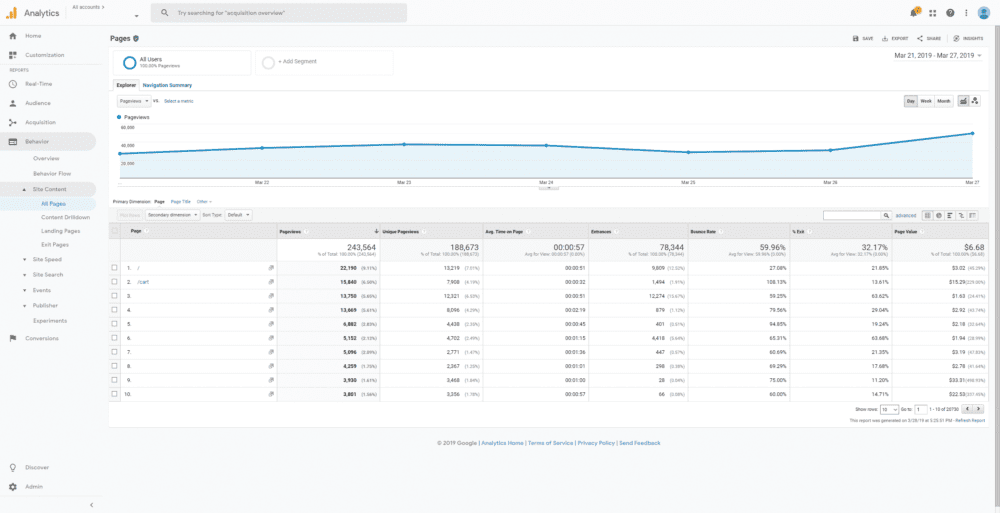
Another report you’ll want to look at is the behavior report. This section of Google Analytics will show you what your users are doing on your site. If you have a lot of traffic but few conversions, this is where you can break down each page of content and really dive deep into the problems your site might be having.
Check the “All Pages” report to check which pages have the highest page views, bounce rates, and exit rates.
You can use the search bar to type in the URL extension to check individual pages or groups of pages.
Examine conversions (bookings) on the individual property pages. If you don’t have good conversion rates now, you should be testing the site design, listing descriptions, images, and more.
Using Your Data
As you start looking at these different numbers and familiarizing yourself with the various reports and ways to filter data, you will discover many ways in which you can use the data to make changes.
The biggest mistakes people make at this time are making the wrong changes and making too many changes at once.
- If your traffic is high, but you have high bounce rates and low page views, you probably have a website problem. In this case, you may need to look at page speed and mobile views or get a website review, but first, try to rewrite some content or get better images.
- If your organic search traffic is low and your site is at least a few months old, you should make sure your site is listed with Google’s Search Console and look at your meta descriptions and meta keywords.
- If you don’t have much traffic at all from any sources, you have a marketing problem. Learn the different marketing strategies that work best for you and your audience. Social media ads, especially on Pinterest and Facebook, can work quickly to get you some traffic.
- If you have high traffic and engaging content and still have low booking rates, look at your property-specific pages. Do you have well-placed booking forms and calls to action? Are your images professional? Do your booking forms work? Is there a way for visitors to easily find your contact info? Does your listing copy entice them to book your property?
As you can see, there are a lot of details to be found within your Google Analytics dashboard, and it should be clear that this is a tool you need to use to learn more about what is going on with your website. The keys to making money in any online business are to learn how to use different strategies and marketing tactics correctly to bring more traffic to your website and to use the data you see to make informed decisions that work for you and your business.


