Over the last two decades, experienced vacation rental professionals have predicted market performance using a set of economic indicators, including real estate activity, consumer confidence, unemployment, hotel performance, gas prices, international travel behavior, and vacation rental awareness.
The effect of these indicators differs across destinations. What is a positive sign for ski markets can be a negative predictor for southeast beach destinations, and metrics that are positive indicators for destinations reliant on airline traffic can negatively affect drive-to markets. Additionally, in destinations with a major metropolitan market as the top feeder market, indicators perform differently than in drive-to markets whose major feeder markets are more heavily composed of mid-size cities and rural areas.
In the vacation rental industry, we are just beginning to establish definitive correlations between economic conditions and realized performance, but as the vacation rental industry matures, analysts are taking more time to research and create new sets of destination-based predictive economic indicators to adjust pricing and more adequately prepare for the future.
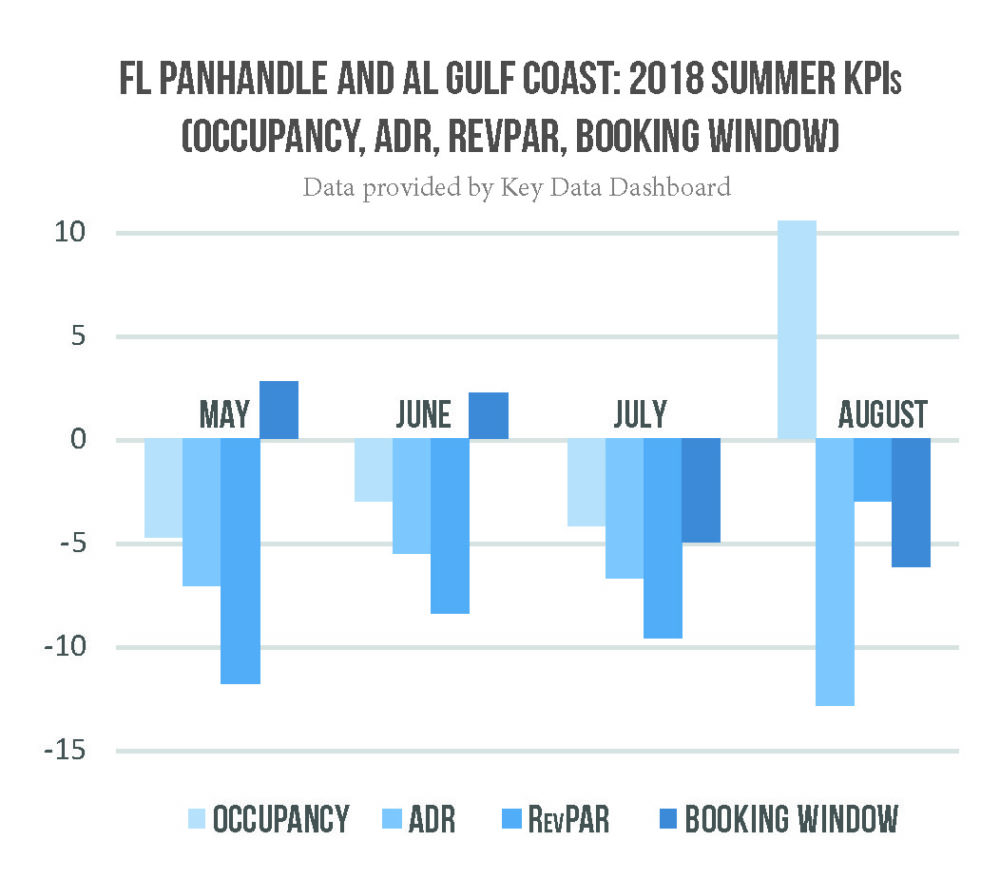
Now that the industry is starting to participate in and utilize integrated comparative data tools, vacation rental managers are beginning to get actual, real-time performance metrics, and several destinations are finding that realized performance during the 2018 summer months didn’t follow predicted trends. Although some vacation rental destinations saw record-breaking performance, other markets, most notably along the Gulf Coast, experienced a disappointing season—leaving destination analysts to wonder: Are predictive indicators holding, or is there a shift in consumer behavior?

For new vacation rental managers, the idea of monitoring economic indicators may also be new, so let’s look at an overview of common predictive sets widely used in the vacation rental sector.
Real Estate Market
Vacation rental performance has been closely tied to real estate performance because, historically, destinations go in and out of favor among vacation renters and second-home buyers in parallel fashion. Approaching the 2018 summer season, the real estate boom was in full swing.
However, real estate analysts are already seeing signs that the peak of this cycle occurred in August, as early economic indicators are beginning to show a slowdown:
- The number of new construction permits declined 5.5 percent in August from last year. (U.S. Census Bureau and the U.S. Department of Housing and Urban Development)
- Mortgage rates are on the rise. The 30-year fixed-rate mortgage rate averaged 4.65 percent in late September, according to Freddie Mac, marking the fourth straight weekly gain.
- Sales of previously owned homes, as of August 2018, are 1.5 percent lower year to date than in the same period last year, just months after finally regaining a post-crisis high. The decline in home sales occurred despite a shortage of supply, which has pushed housing prices to record highs in many major markets across the country. (National Association of Realtors)
- The median existing-home price for all housing types in August was $264,800, up 4.6 percent from August 2017 ($253,100). August’s price increase marks the 78th straight month of year-over-year gains. (National Association of Realtors)
- For millennials aged 25 to 34, homeownership is eight percentage points lower than baby boomers at that age and 8.4 points lower than Generation X. (The Urban Institute)
Pro Tip: The conditions in your market can differ greatly from the macro conditions in the United States. Professional markets will find it beneficial to compare their individual market(s) to overall performance in establishing an optimal set of indicators.
Consumer Confidence and Unemployment
According to the Conference Board Consumer Confidence Index®, U.S. consumer confidence surged to 133.4 in August, a near 18-year high, as households remained upbeat on the labor market, pointing to strong consumer spending that should help to sustain the economy for the remainder of the year.
For many vacation rental managers, performance over the summer paralleled the index with small declines in June and July, followed by an upswing in August.
“Consumer confidence increased to its highest level since October 2000 (Index, 135.8), following a modest improvement in July,” said Lynn Franco, Director of Economic Indicators at The Conference Board. “Consumers’ assessment of current business and labor market conditions improved further. Expectations, which had declined in June and July, bounced back in August and continue to suggest solid economic growth for the remainder of 2018. Overall, these historically high confidence levels should continue to support healthy consumer spending in the near term.”
Unemployment in the United States fell to 3.9 percent in August 2018, down from 4.4 percent in 2017, 4.9 percent in 2016, and 5.1 percent in 2015, according to the U.S. Bureau of Labor Statistics.
Hotel Performance
The value for vacation rental managers in looking at hotel data is the age-old question: “Is it travel, or is it us?”
STR Global reported that the U.S. hotel industry showed mixed results in the three key performance metrics during July 2018. In year-over-year comparison with July 2017, the industry posted the following:
- Occupancy fell .2 percent to 73.6 percent.
- Average daily rate (ADR) increased 2 percent to 133.44.
- Revenue per available room (RevPAR) increased 1.8 percent to $98.17.
According to STR, U.S. hotels have now posted 101 consecutive months of year-over-year RevPAR growth. “The heart of the summer vacation season helped the industry establish an all-time record in demand, which topped 120 million room nights sold for the first time in history,” said Jan Freitag, STR’s senior VP of lodging insights. “However, there was enough supply growth (+2.1%) to outpace the year-over-year increase in demand (+1.9%), and that led to the first monthly occupancy decrease in the U.S. since last July. That, combined with just a 2% lift in ADR, produced our lowest RevPAR increase since April 2017 . . . As we noted in our revised forecast released last week at the Hotel Data Conference, we expect the industry to continue breaking demand records through 2019.”
Pro Tip: Experienced vacation rental revenue managers take a deeper dive into leisure travel versus business travel and into related individual markets.
Gas Prices
Gas prices barely budged through the 2018 summer, with the national average for regular gasoline hovering around $2.85 a gallon since mid-June. That’s down slightly from a high of nearly $3.00 at the end of May, but it’s still about 43 cents a gallon more than drivers paid at this time last year.
However, compared to the 2014 summer when gas prices averaged $3.70, most vacation rental industry analysts looking at drive-to markets do not believe that changes in gas prices had a significant impact on consumer traveler behavior in 2018.
International Travel
The 2018 impact from changing international travel behavior has two faces: Inbound travel to the U.S., and outbound travel from the U.S.
For destinations reliant on inbound travelers, incoming international arrivals to the U.S. were down 4 percent in the first three quarters of 2017. By comparison, international tourism arrivals worldwide in 2017 were up 7 percent, representing the strongest result in seven years, figures from the United Nations World Tourism Organization (UNWTO) show. In addition, the UNWTO says Spain is about to replace the United States as the world’s second most popular tourist destination, after France. And according to surveys conducted for the 2018 U.S. News Best Countries Rankings, the United States fell from the fourth best country in the world in 2016, to No. 7 in 2017, and down to No. 8 in 2018.
As a result, in 2018, the U.S. Travel Association launched a “Visit US” coalition with other U.S. industries to reverse declining U.S. competitiveness for international travel dollars.
However, many destinations have few non-U.S. travelers. For these markets, a decrease in international travel is a positive indicator as more U.S. travelers vacation domestically.
Nevertheless, despite a decrease in international travel to the U.S., American travelers are taking more vacations outside of the U.S. According to the U.S. Department of Commerce, National Travel and Tourism Office (NTTO), the number of U.S. citizens traveling to international regions increased 9.3 percent from 2016 to 2017. The NTTO reported the top two destinations for U.S. international travelers were Mexico and Canada. Travel to Mexico (31.2 million) was up 9 percent, marking a new record for the fourth straight year. Mexico now holds a 39 percent market share of all U.S. outbound travel. U.S. travel to Canada (13.9 million) was up 10 percent.
Vacation Rental Awareness
The awareness of vacation rentals as a lodging alternative has increased among consumers. According to Phocuswright’s 2017 study, “A Market Transformed: Private Accommodation in the U.S.,” “In 2015, nearly half of U.S. travelers either rented or considered renting private accommodation, compared to just 35 percent in 2014.”
A recent Booking.com survey showed, “One in three travelers (33 percent) say they’d prefer to stay in a holiday rental (a holiday home or apartment) over a hotel.”
Proponents of OTAs, including Booking, Airbnb, Expedia, and TripAdvisor, often point to the increase in awareness for vacation rentals as their biggest contribution to the industry. David Angotti, in his article, “Long Live the OTAs!” in the spring issue of VRM Intel Magazine, wrote: “The larger a listing site becomes, the more powerful the brand can become and, ultimately, the whole industry benefits . . . The economies of scale are bringing additional awareness for our industry and shifting the supply and demand curve in a way that benefits us all.”
The Future of Economic Indicators for the Vacation Rental Industry
Consumer behavior in the U.S. is quickly becoming a tale of two worlds, with economic conditions for inhabitants in major U.S. cities differing greatly from rural residents. In looking at these indicators, professionals in the vacation rental industry will find it increasingly beneficial to analyze economic and behavioral conditions in their feeder markets, rather than relying on macro-U.S. data.
Moreover, a positive indicator for urban markets might be a negative indicator in traditional, drive-to vacation rental markets.
Thankfully, the era of self-reported comparative data is coming to an end and is being replaced with real-time data that is integrated with property management software systems for apples-to-apples comparison. As the vacation rental industry matures, and comparative market data is available on a market basis, the correlation between economic conditions and actual performance will become rapidly clearer. And the best news is that professional managers will not have to wait as new market data platforms are able to pull in data from previous years.
Comparing monthly vacation rental comparative performance metrics for the last three to five years to destination and feeder markets—such as new construction permits, single and multi-family real estate performance, the Consumer Confidence Index, unemployment rates, in-market hotel performance, international travel behavior, and sector awareness—is likely to yield a strong trend pattern for a professional manager that will help to establish a strong set of predictive indicators.
As the vacation rental industry becomes more professionalized and comparative market data is more trusted and utilized, property managers will evolve in measuring how leading economic indicators aid in predicting performance for each individual destination and for specific traveler demographics.
In analyzing trends in the economy and in consumer behavior, the vacation rental industry is maturing rapidly. The most exciting part of being in this industry, at this time and place, is the opportunity as vacation rental professionals—including technology providers, marketers, and property managers—to be the first to identify and measure correlations between these shifts and company performance.


