COVID-19’s impact on the travel industry will be analyzed, studied, and debated for years to come. Several sectors, like cruise travel, business travel, and experiences, were almost decimated. In contrast, the leisure-based, whole-home, short-term rental (aka, vacation rental) sector quickly rebounded in areas that were able to reopen.
Vacation rentals performed better, year over year, than other accommodation types as a whole. However, success varied greatly from one destination to another. There is nothing average about our national average statistics.
Throughout last year, we heard much anecdotal analysis about how vacation rental destinations were reacting, but how did the year turn out? Now that the book on 2020 has closed, we’re able to examine how the year actually played out.
Below, we examine 2020 performance by month for eight destinations that Key Data’s Melanie Brown and I have been tracking since 2018 and first reported on in the Fall 2019 article, “18-Months in Review.” In particular, we’ve been monitoring occupancy, average length of stay (ALOS), average daily rate (ADR), and average booking window (ABW) for each of these regions.
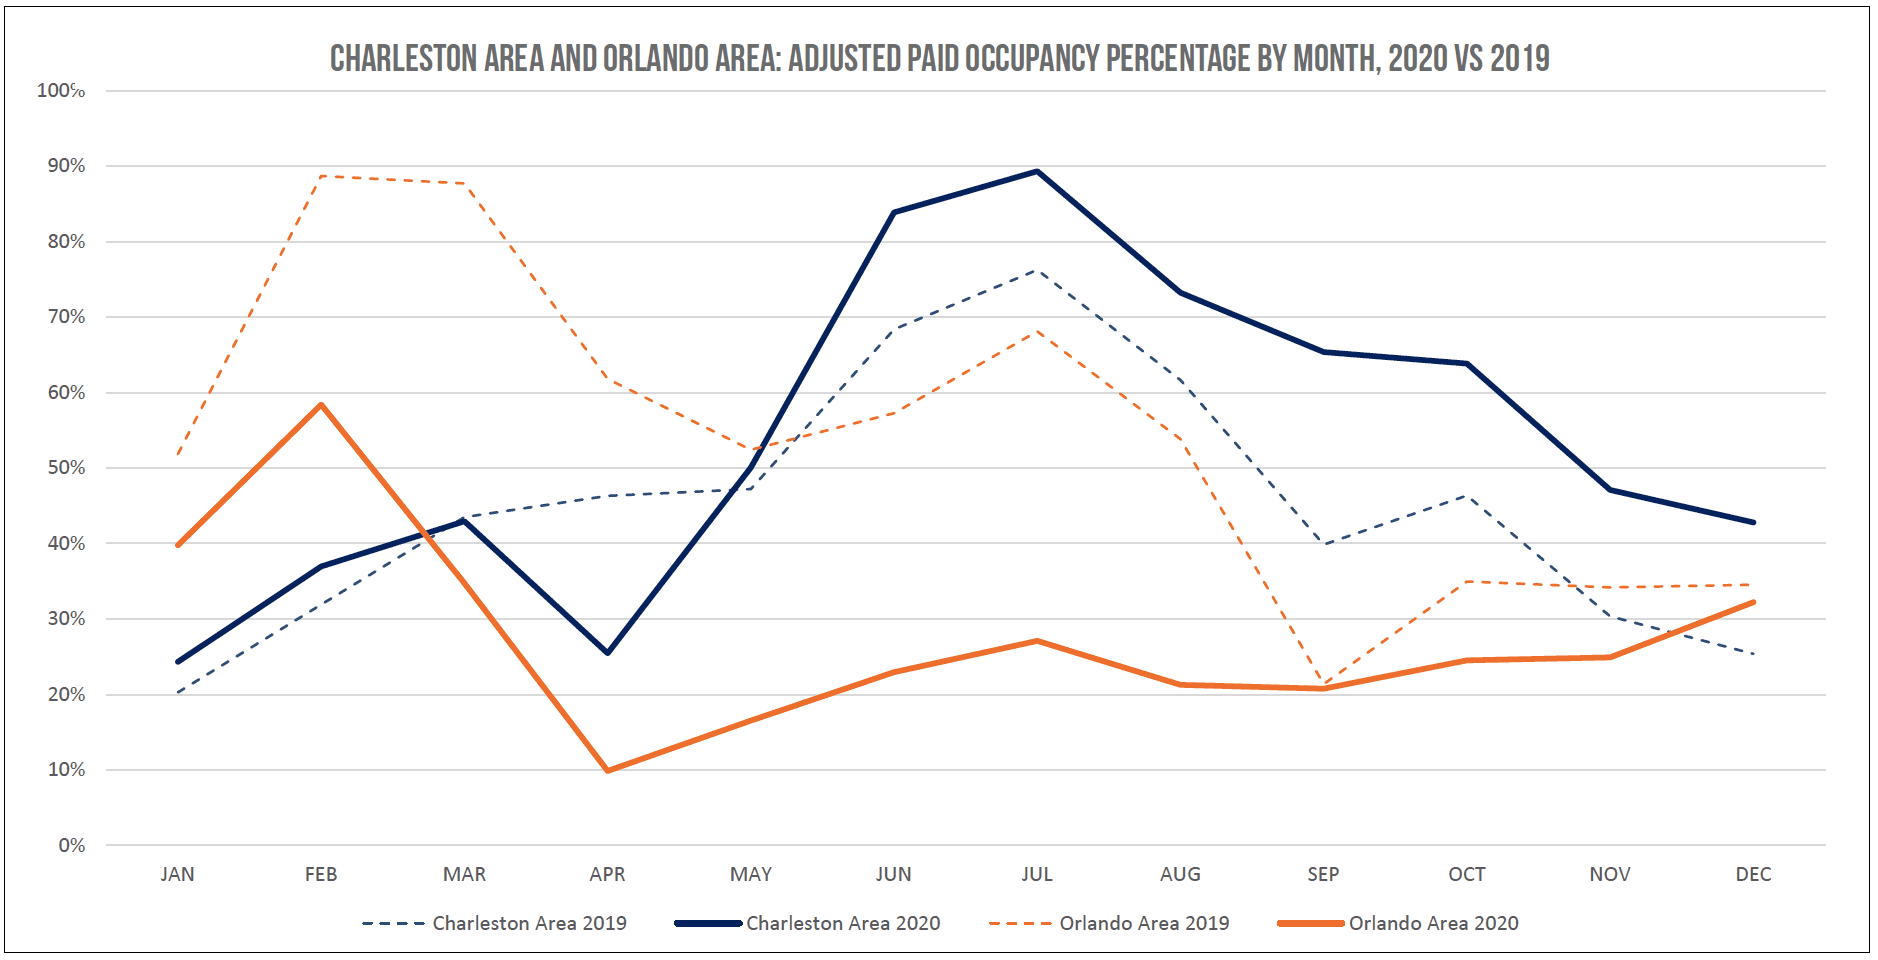
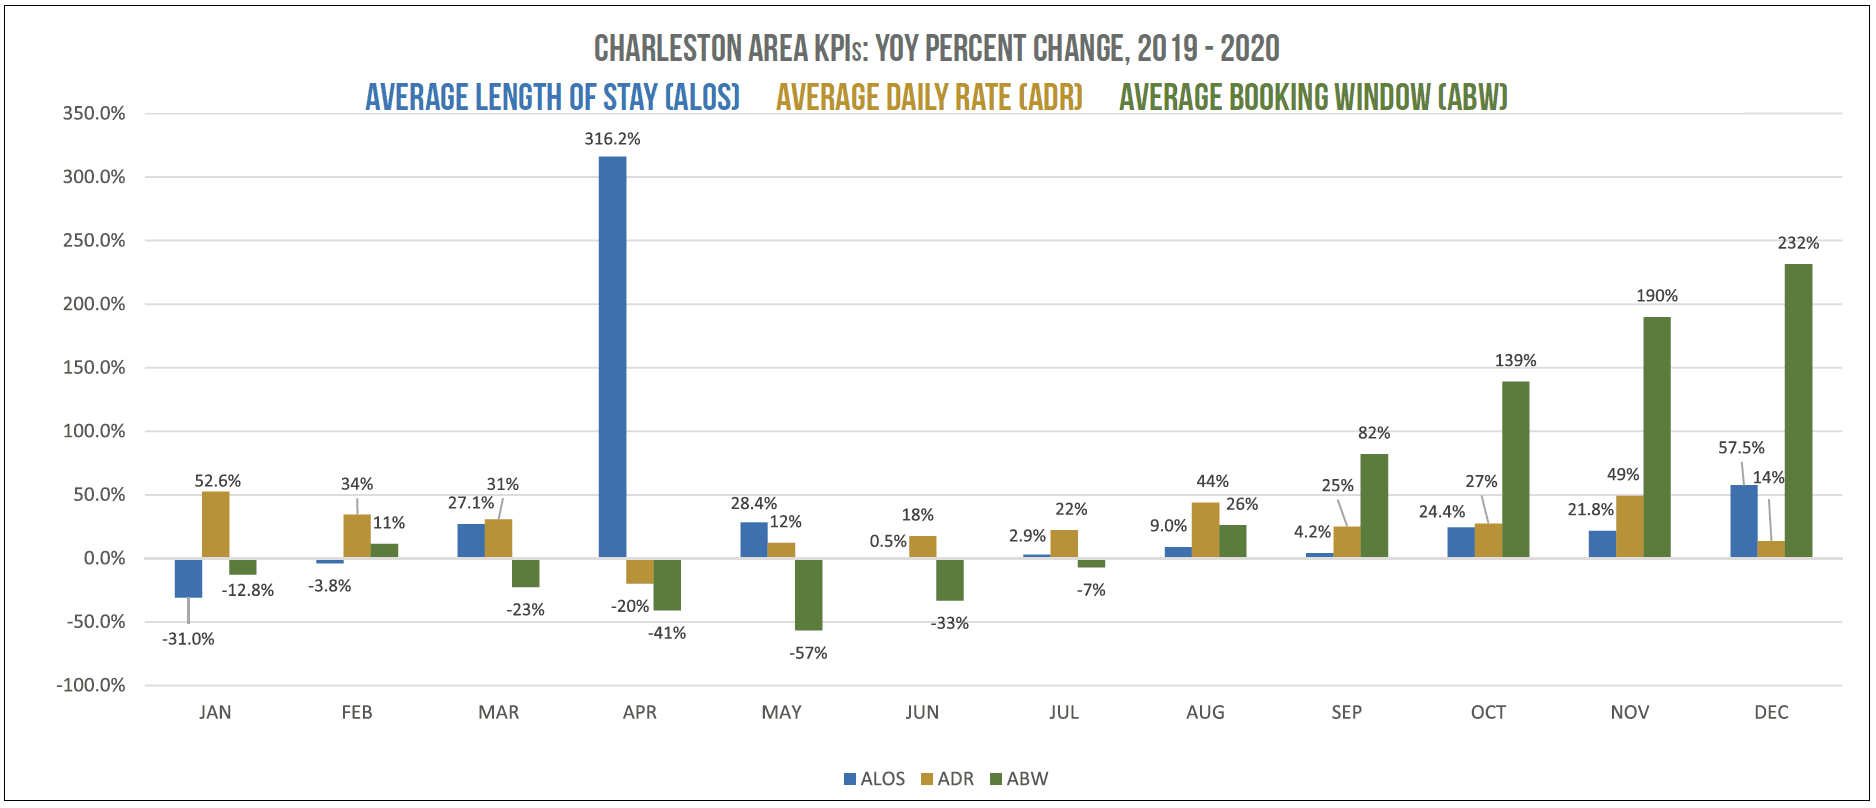
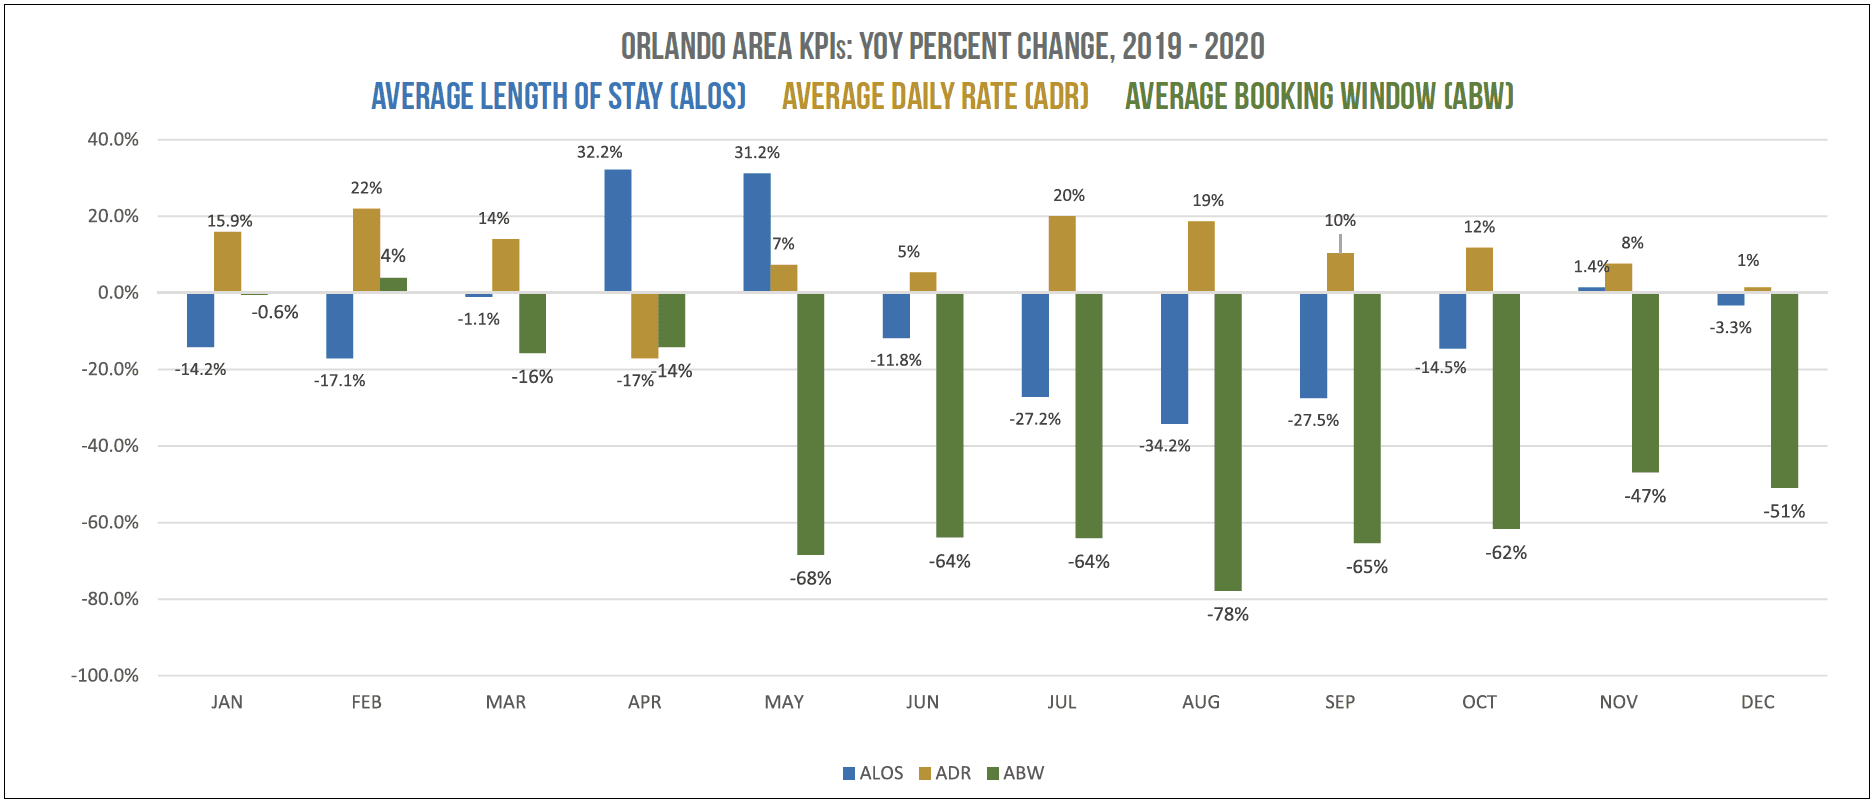
A Tale of Two Leisure Cities: Charleston and Orlando Areas, 2020 vs 2019
Urban markets such as New York and Chicago suffered greatly as travelers fled crowded areas; however, leisure-oriented city markets were difficult to predict. Charleston, for example, quickly rebounded and began exceeding 2019’s occupancy in May, while Orlando is only beginning to see occupancy rates normalize.
Click on the graphs below to enlarge.
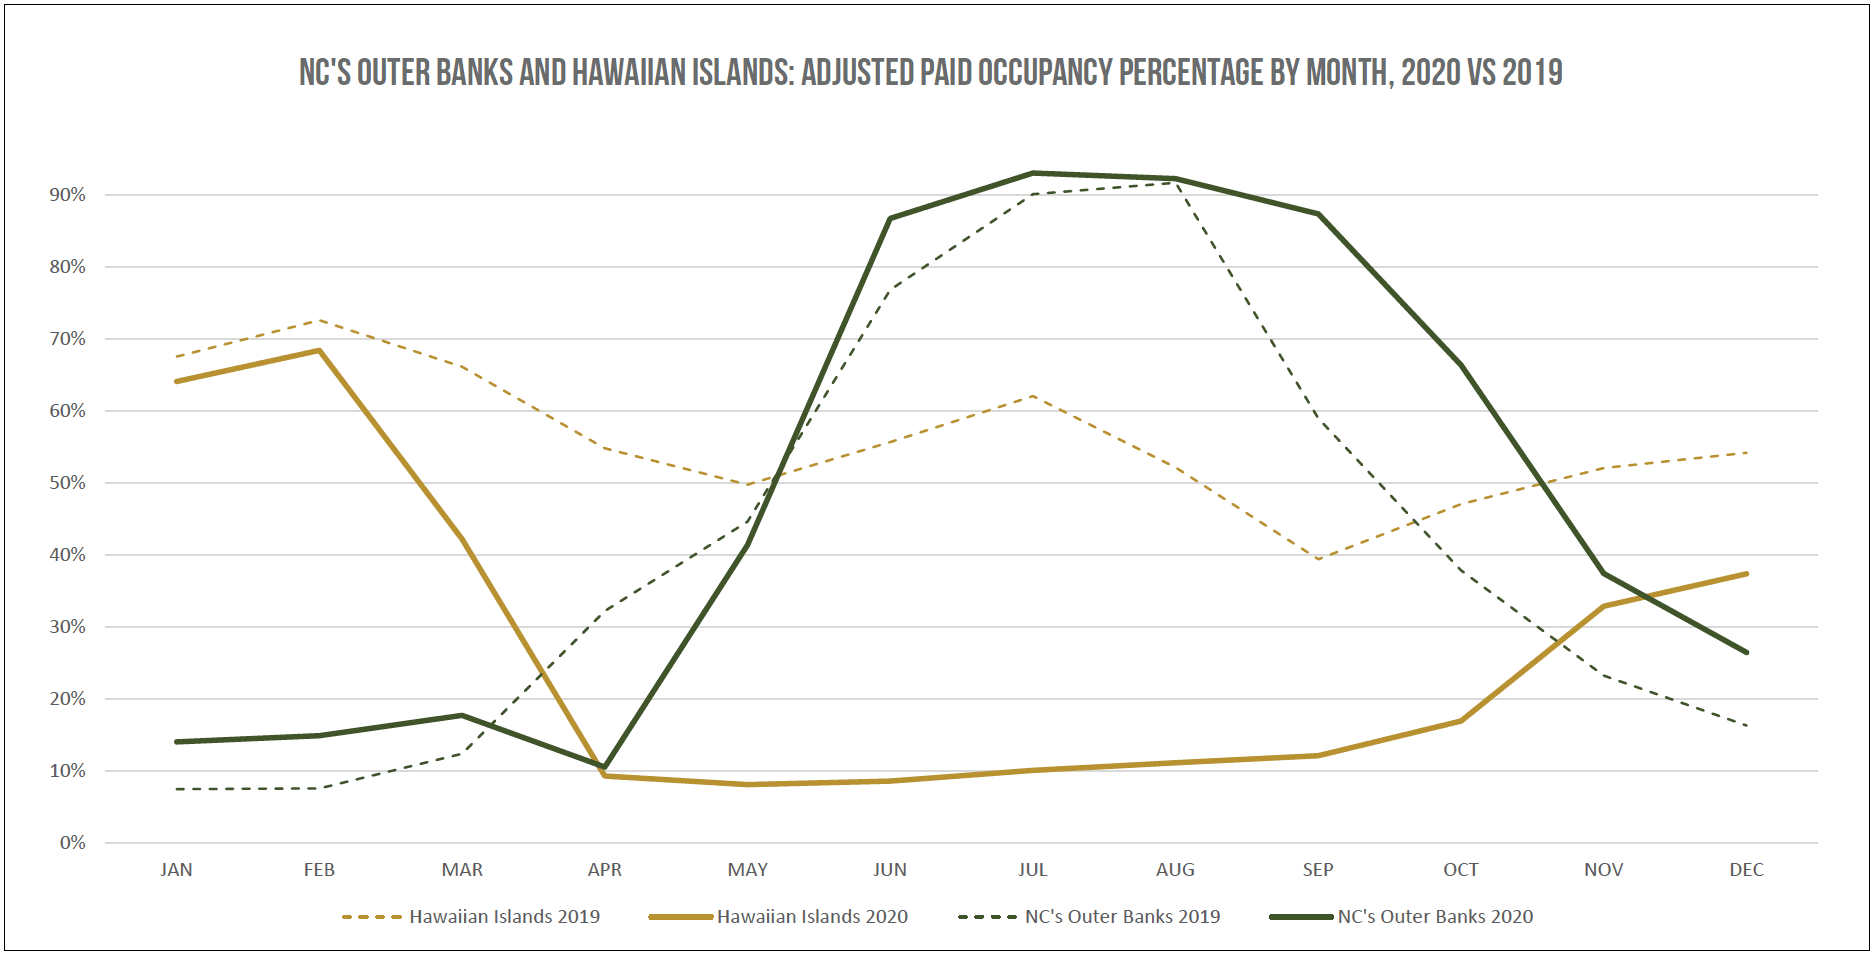
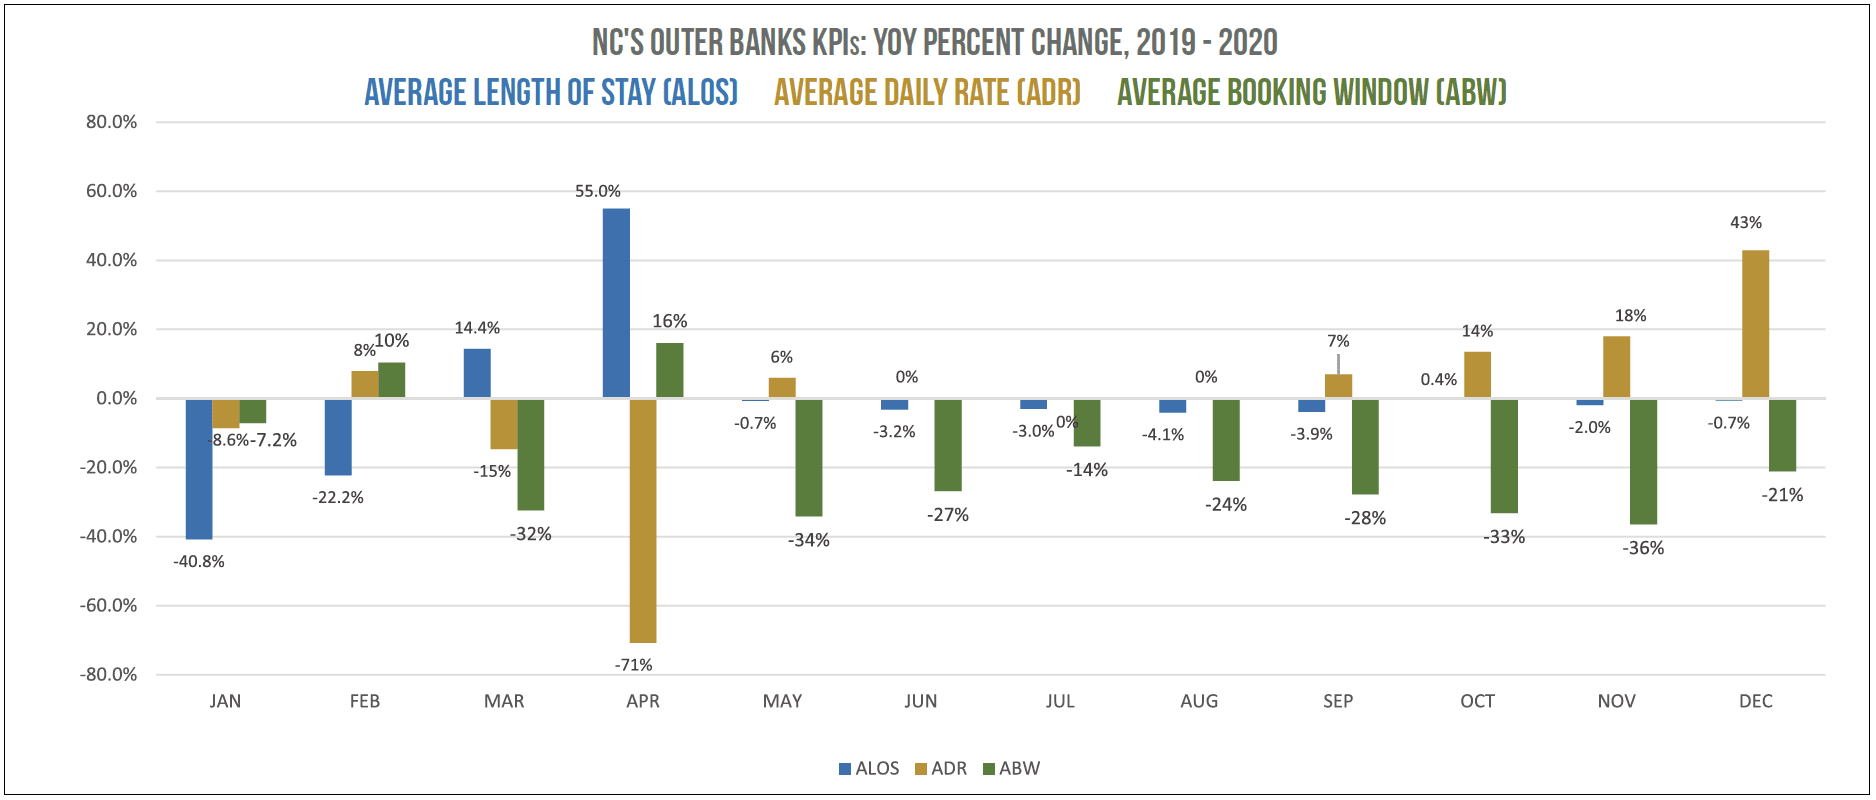
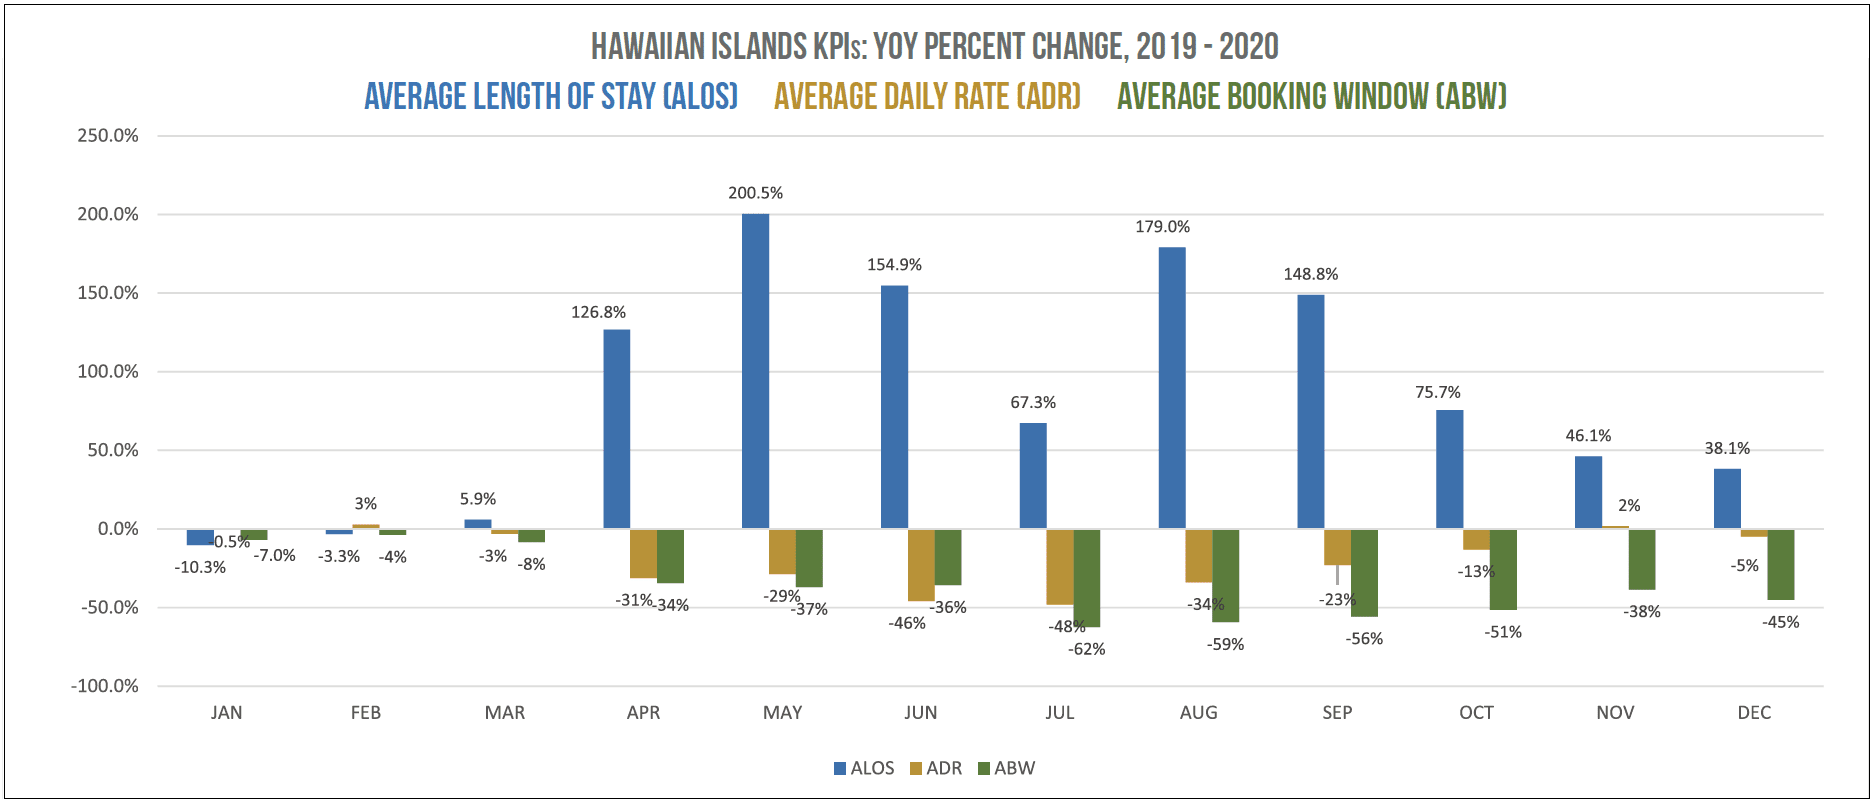
A Stark Comparison: NC’s Outer Banks and Hawaiian Islands, 2020 vs 2019
In comparing vacation rental markets, perhaps the starkest contrast is found when looking at the Outer Banks and the Hawaiian Islands. Hawaii made the decision to protect its population by enforcing strict travel restrictions throughout 2020. In contrast, after a short period of denying access to nonresidents, the Outer Banks—with its large inventory of spacious luxury homes—became the beach escape of choice for city dwellers from several large urban markets and began outperforming 2019 in June.
Click on the graphs below to enlarge.
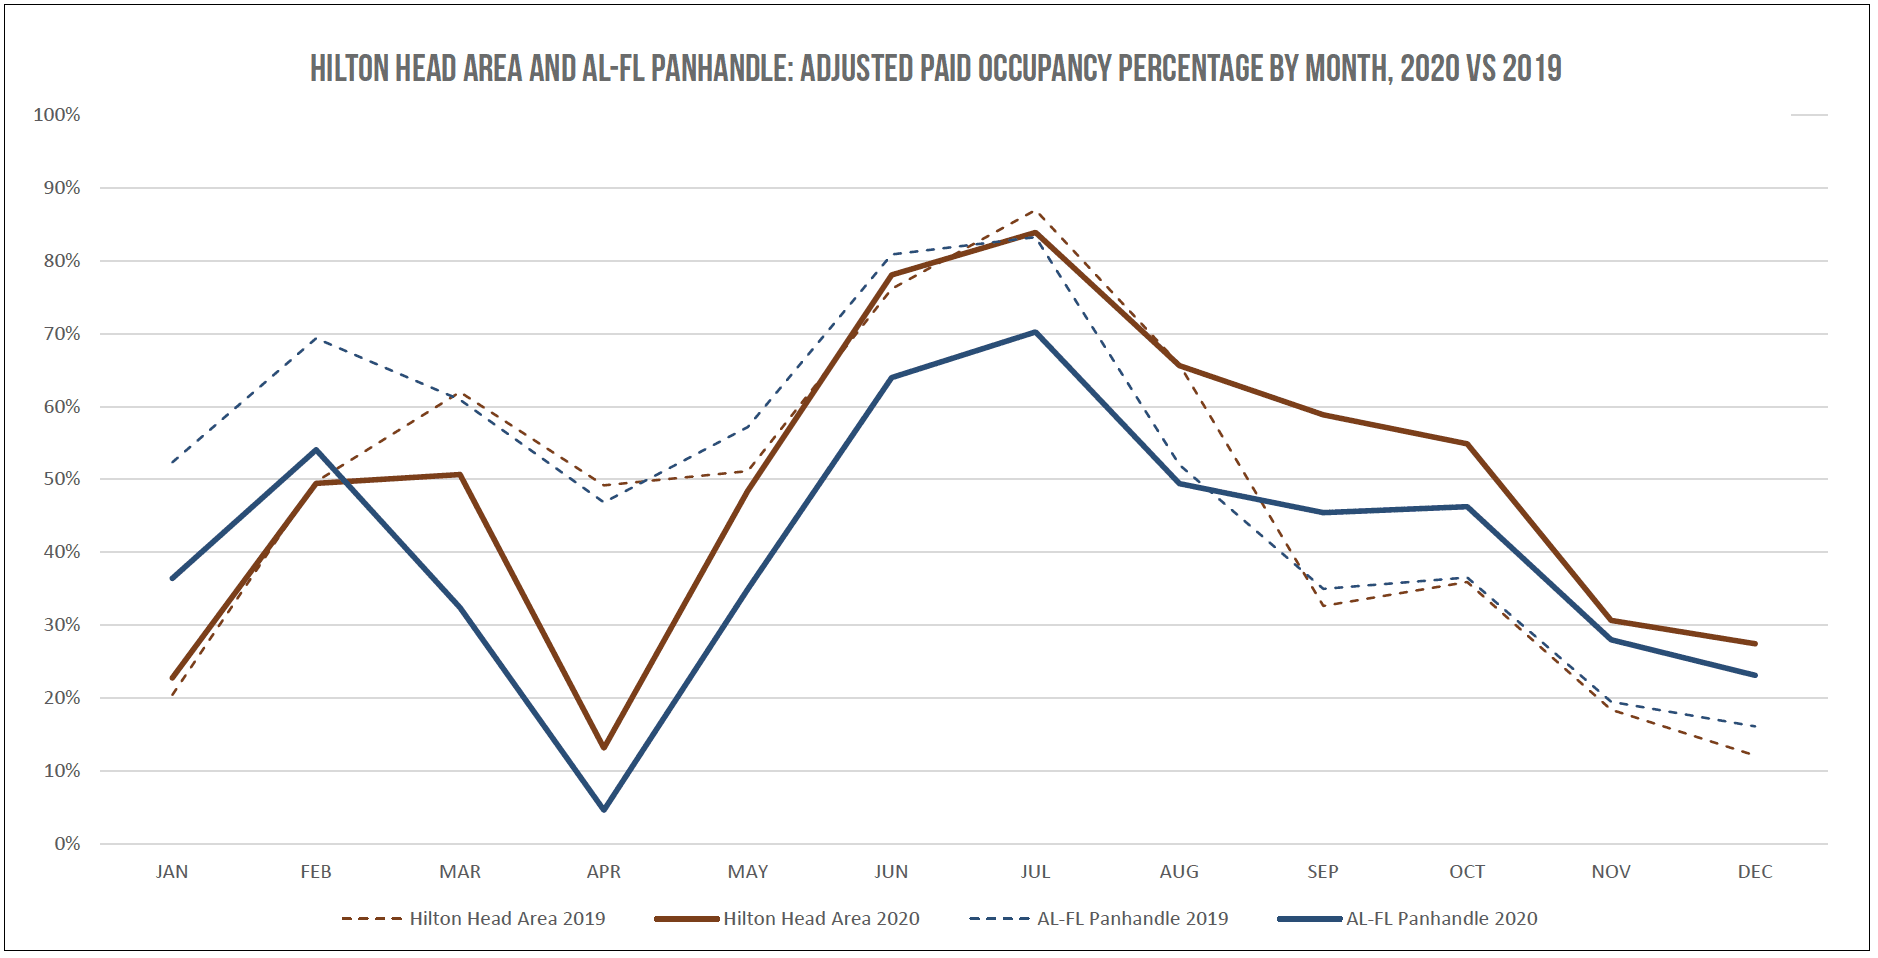
Southeast Beaches: Hilton Head and AL-FL Panhandle, 2020 vs 2019
As we discovered in a VRM Intel study, consumers in the southeastern United States were more likely to travel than those from other areas of the country, benefiting well-known southern beach destinations. With few travel restrictions and short periods of travel restrictions, these destinations ended up following similar trend patterns as 2019.
Click on the graphs below to enlarge.
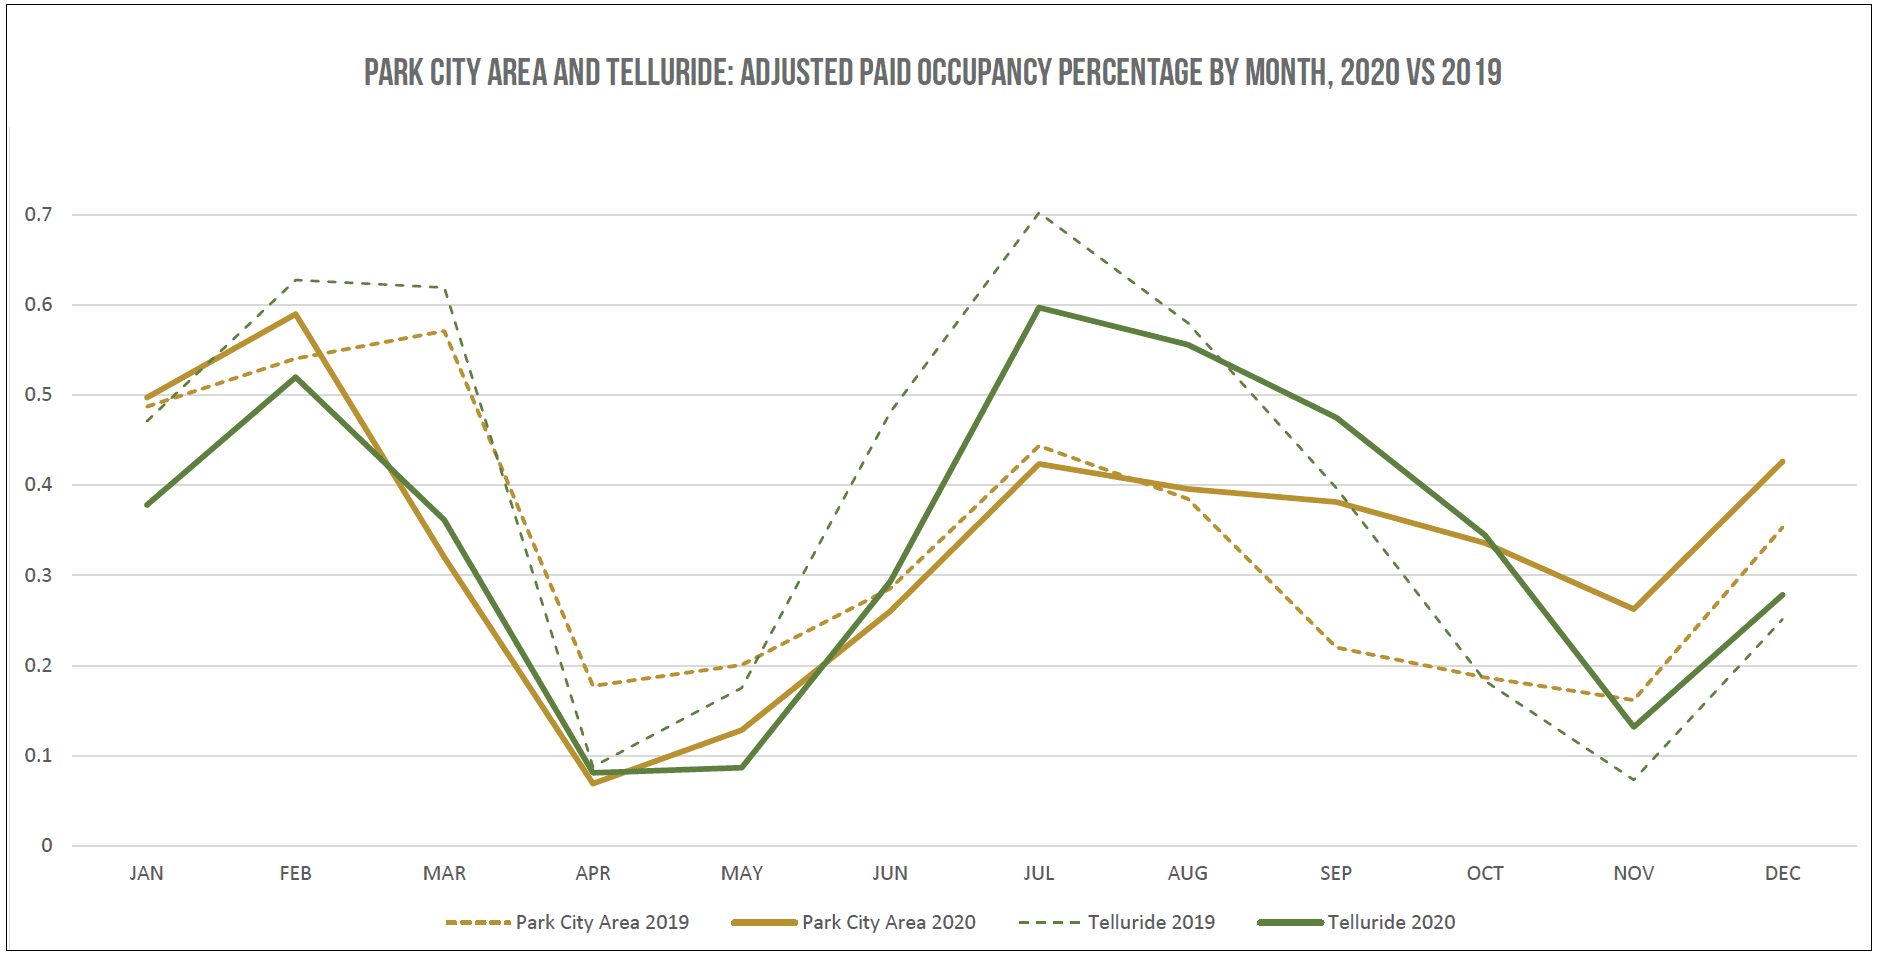
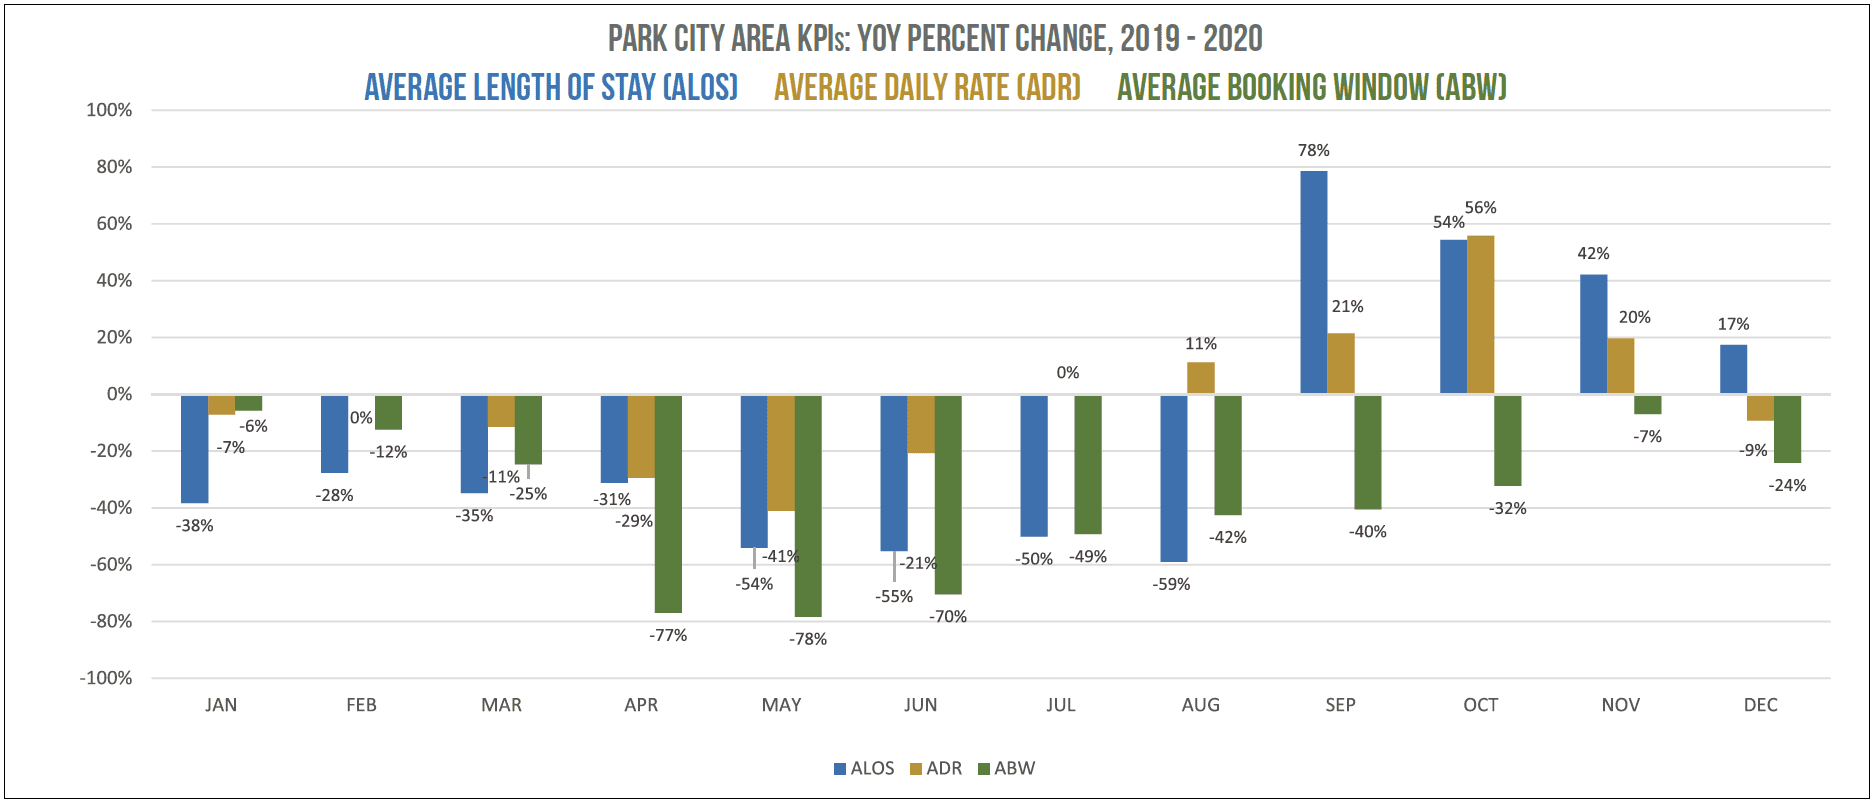
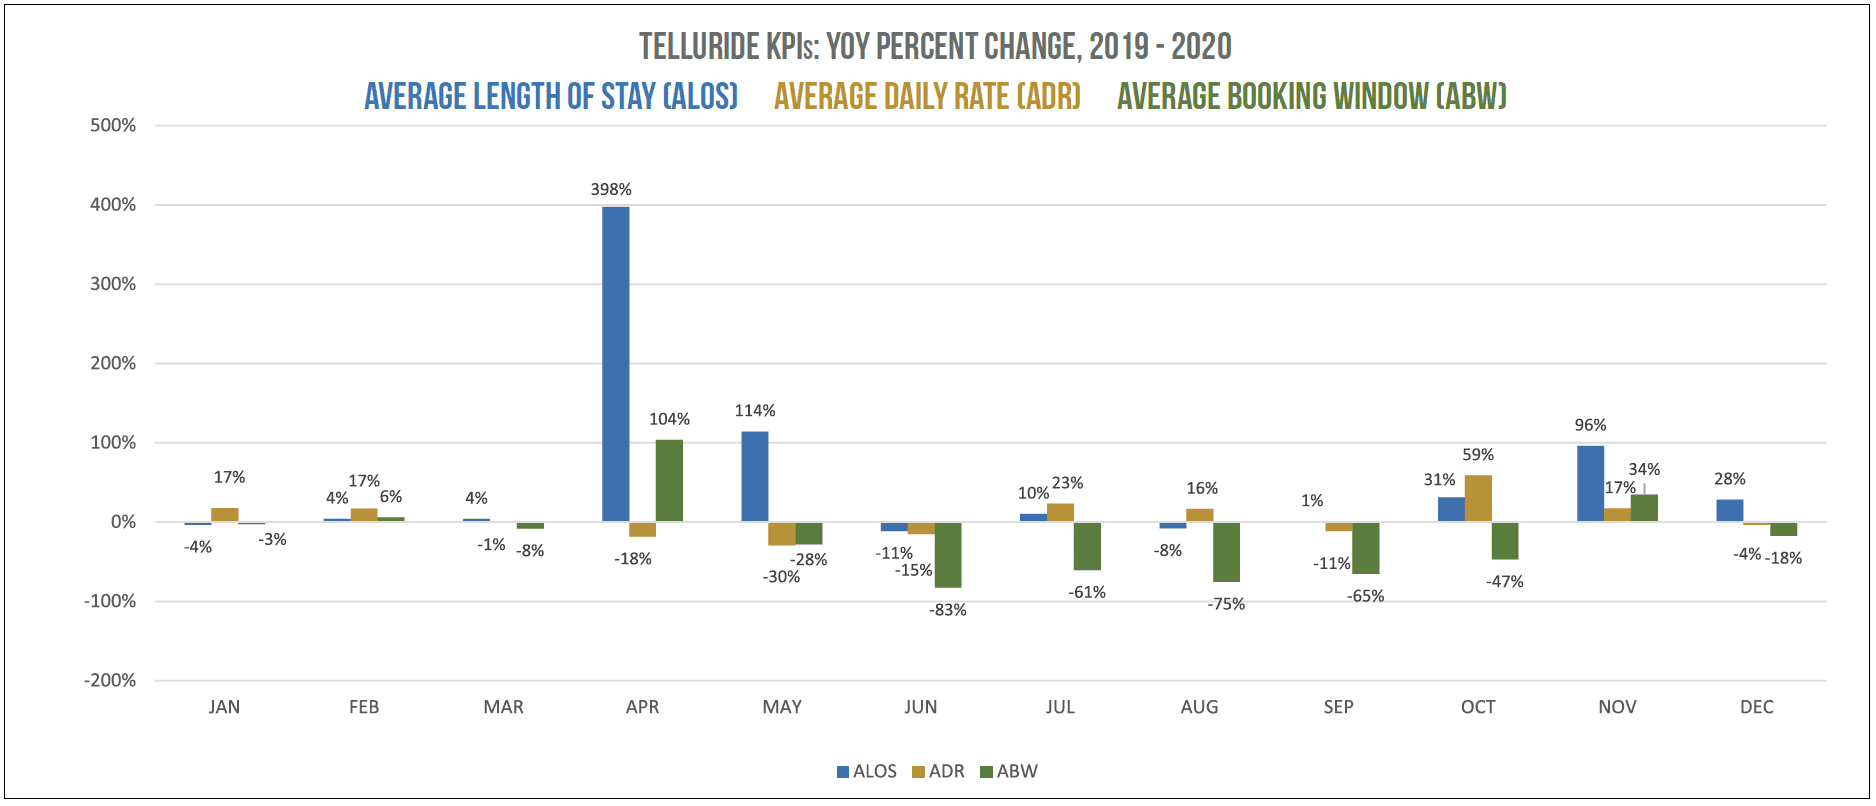
Ski Destinations Began to Bounce Back in August: Park City and Telluride, 2020 vs 2019
Even though ski markets were able to complete a successful January and February, 2020’s Spring Break was essentially destroyed. Although it took some time, these markets began to exceed 2019 performance by the latter part of 2020, but the jury is still out on how the ski season will conclude.
Click on the graphs below to enlarge.
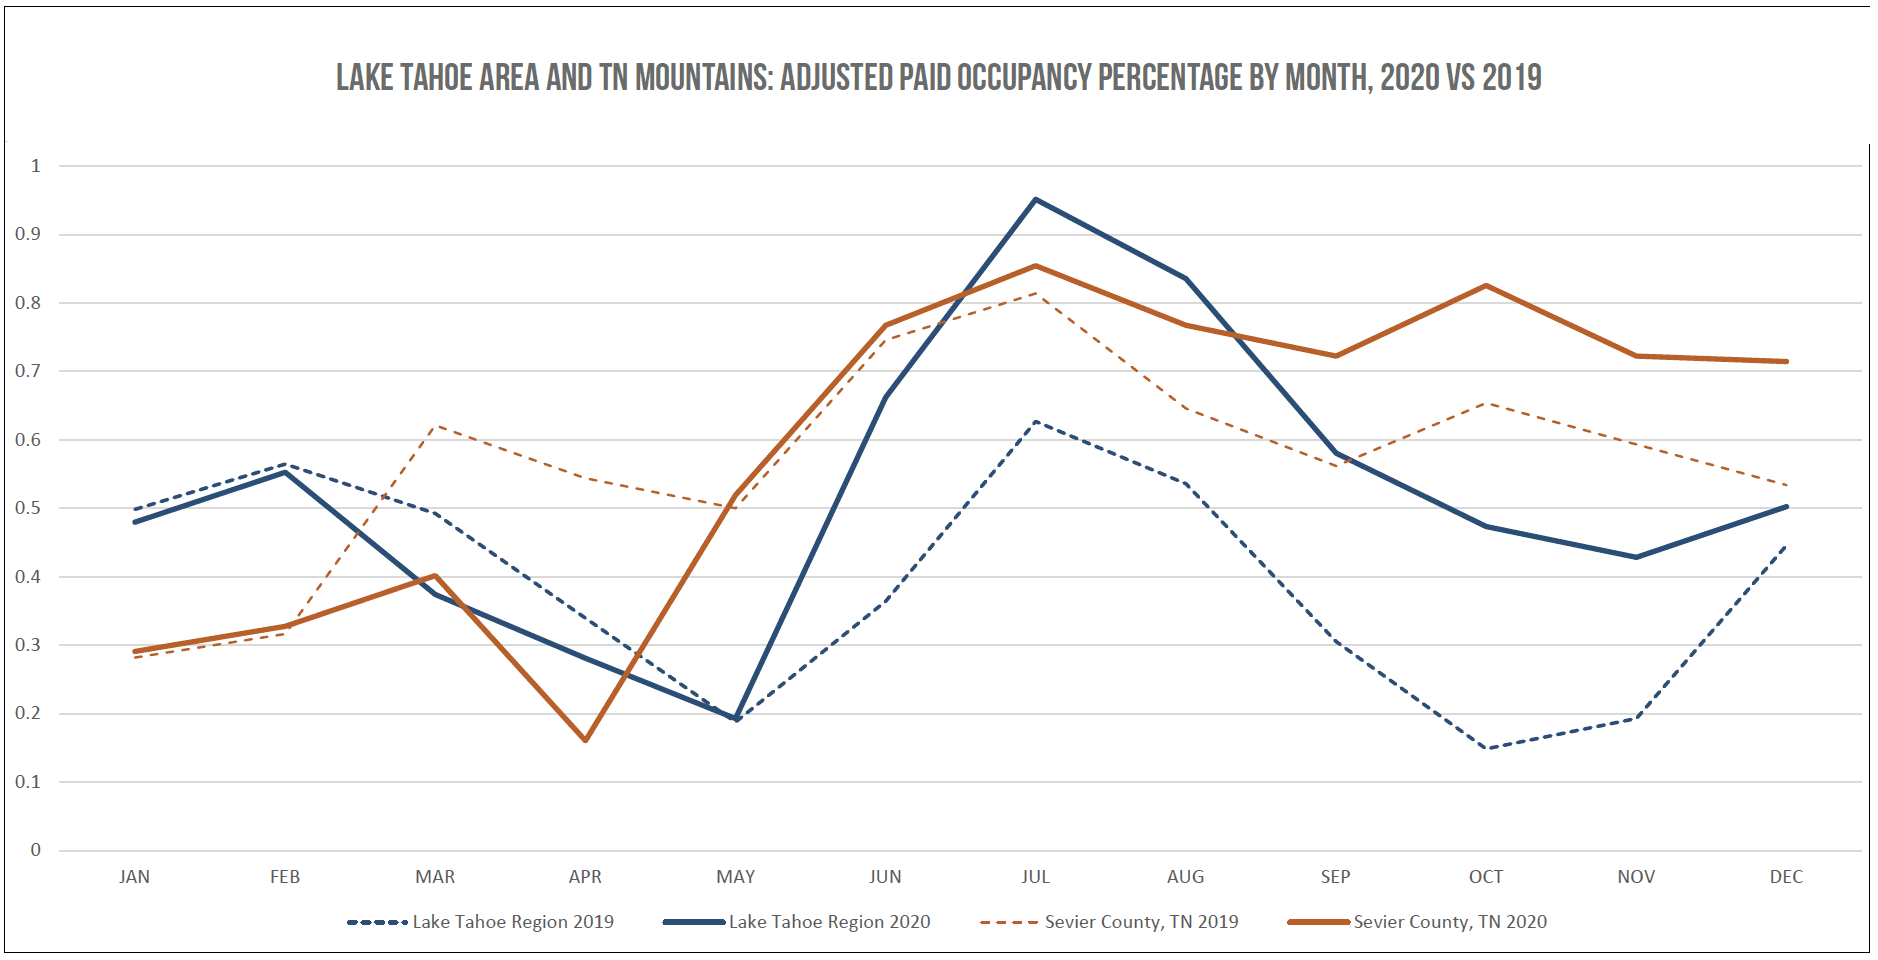
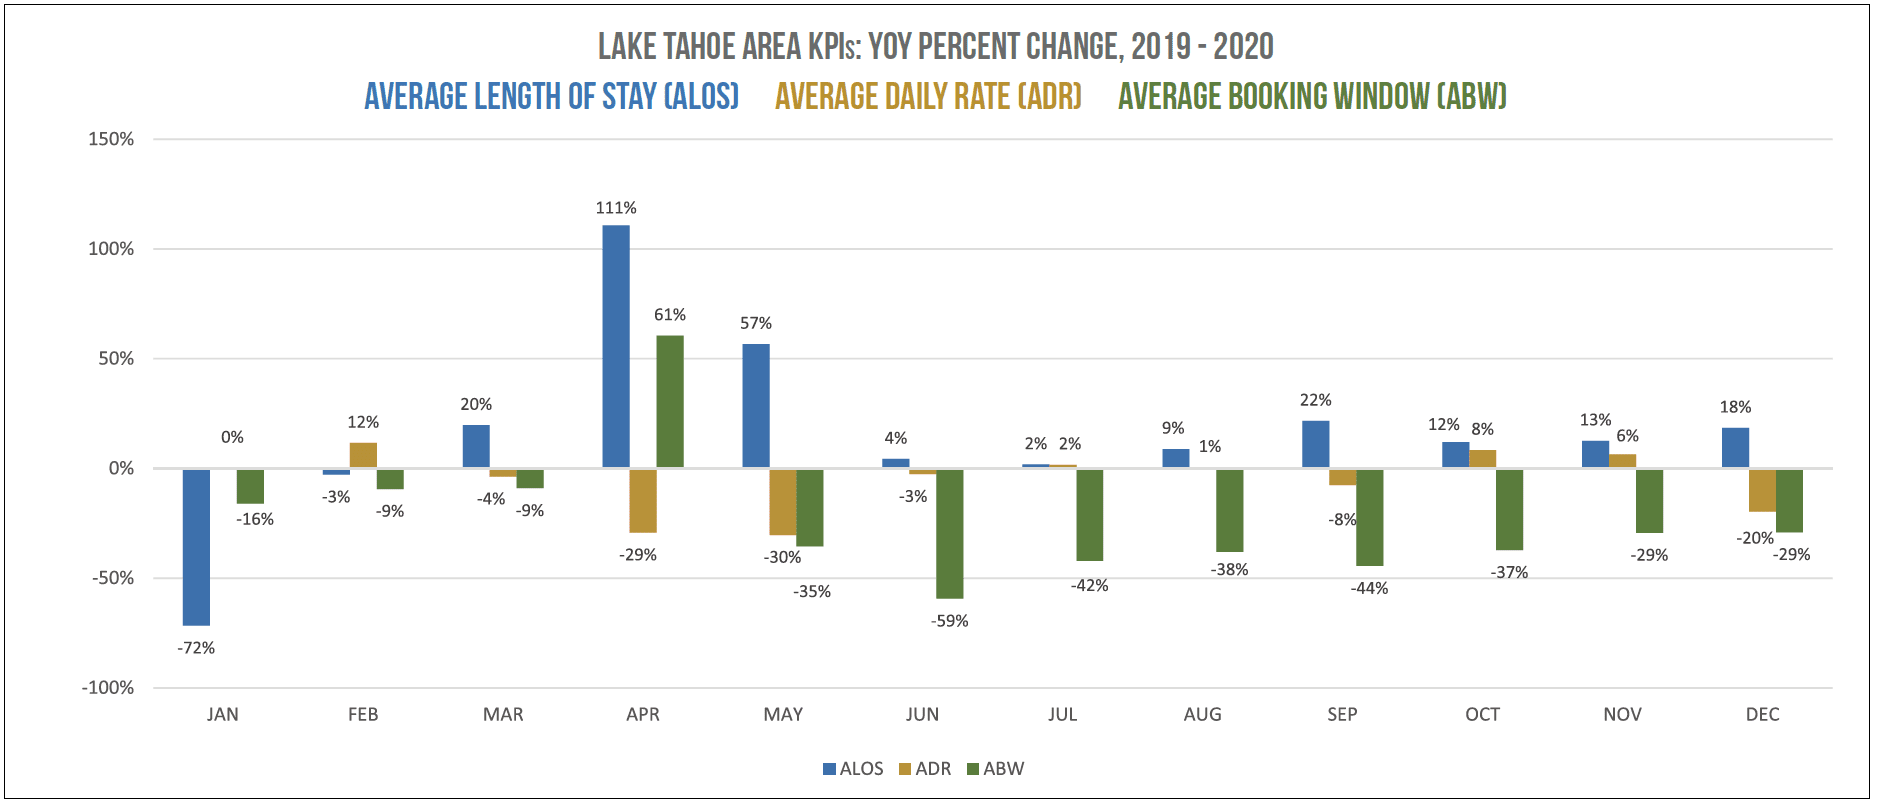
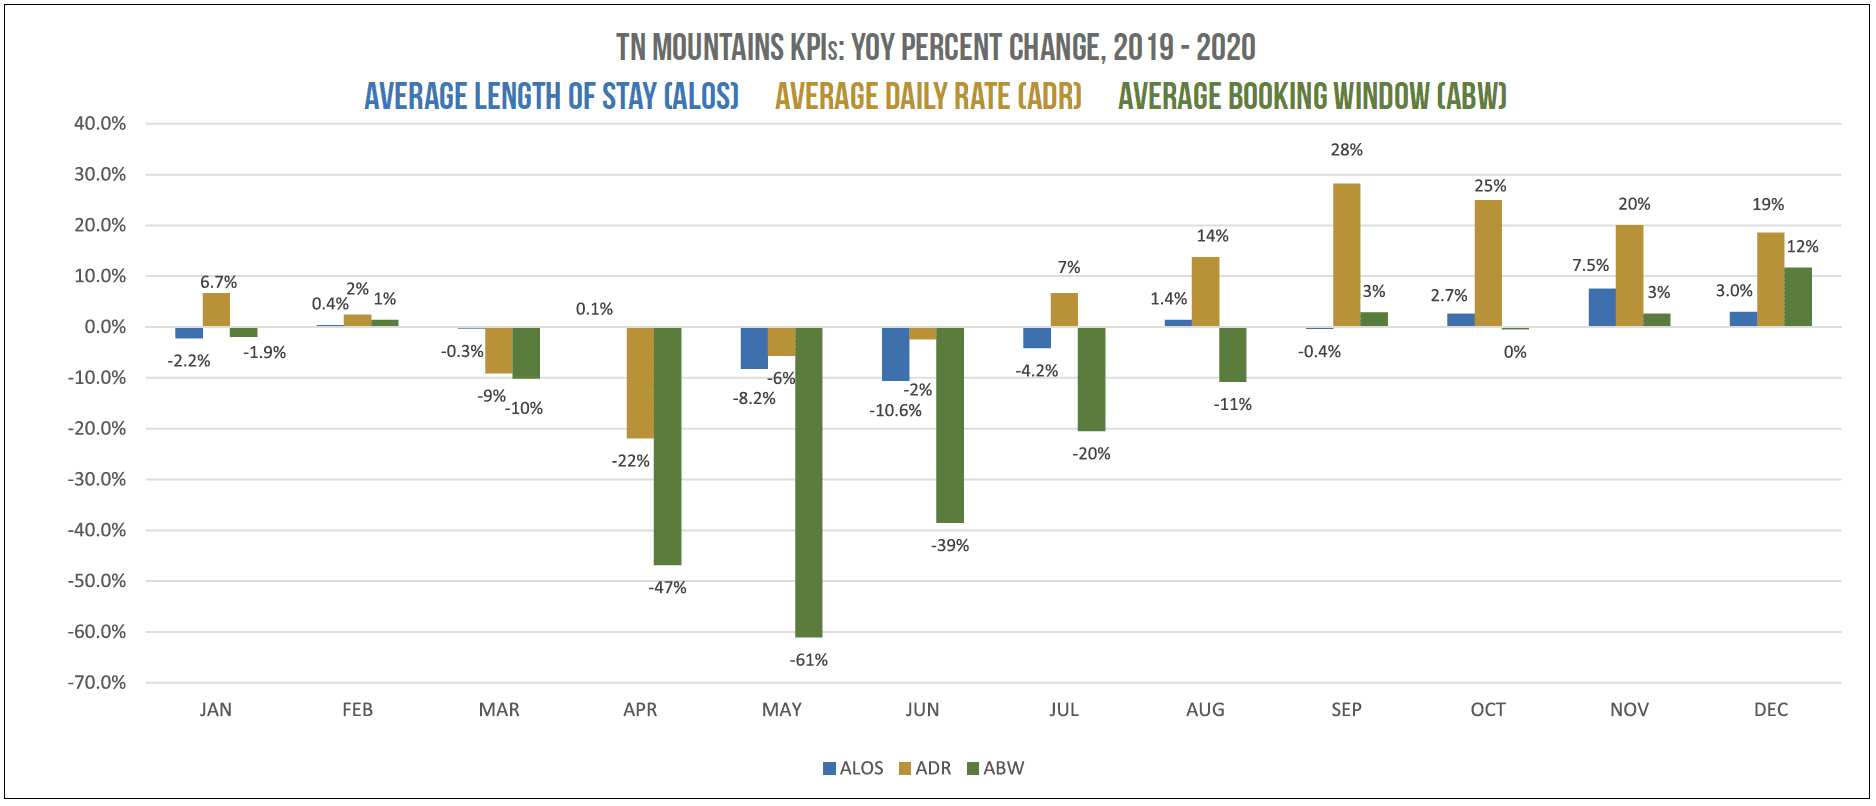
Year-Round Mountain Markets Pulled Ahead in May: Lake Tahoe Area and TN Mountains, 2020 vs 2019
With reliable drive-to feeder markets and strong fall traffic, year-round mountain markets realized some of the travel industry’s biggest gains in occupancy, ADR, and RevPAR. As you will see, by July, these markets were soaring.
For vacation rental executives and marketers, we suggest looking at these same metrics in your own market and identifying like-markets, or markets that perform similarly to your own. Looking forward, monitoring like-markets will help determine whether a trend is market-specific or indicates potential change in consumer behavior.
Click on the graphs below to enlarge.

