Last year was disruptive to our sense of normalcy in so many ways, and the typical trends and patterns we’ve come to count on for vacation rentals were thrown out of whack. Market performance shifts from one destination to another and are regularly affected by fires, hurricanes, and national events. If any industry is accustomed to handling surprise disasters, it is the vacation rental profession. But no markets were immune to the impact of COVID-19; standard metrics were turned on their head.
As we sort through it, while the virus continues to affect us, it’s been more difficult than ever to forecast for the future. Can we count on the “trends” we’re seeing online and hearing from our friends in other markets, or are they unique to their market?
Let’s turn to the data to try to set the record straight on what’s been happening and, more importantly, what we should expect for the coming seasons.
About the Data
Through Key Data, our industry has joined in what is effectively a collective co-op of data sharing. For 2020, the data set represents more than $2.5 billion in US bookings from more than 200,000 properties. Our markets are undoubtedly unique in many ways, but our collective data can now shine some light on our industry and clarify the real patterns as they are happening, many of which may not be what you expect.
Here’s a look at the ones we found most interesting and helpful:
Fact or Fiction? The Average Length of Stay (ALOS) Has Increased.
Mostly fiction, but it depends on the market.
 There is much talk about how ALOS is increasing significantly. But is it for our professionally managed vacation rentals? It would seem to make sense with COVID-19. People working from anywhere can stay longer. Many kids are doing school online. Here’s what the data shows.
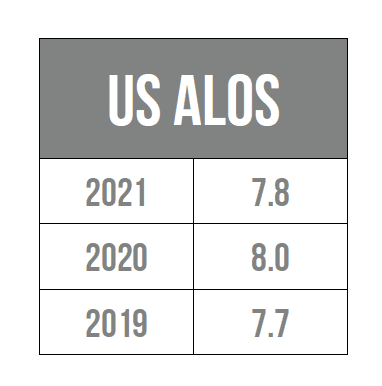
For the entire US, ALOS on the books for the first six months of 2021 is pacing almost exactly in line with 2019, showing an average of 7.8 days versus 7.7 days in 2019. For 2020, four weeks in late March and April saw spikes raising the average for the period to 8.0 days, but this came when most markets were shut down, and there were only a handful of guests essentially holding in place. Absent this anomaly, the US professional market is not seeing an overall increase in ALOS.
So where is the chatter about ALOS increases coming from? Two places we believe.
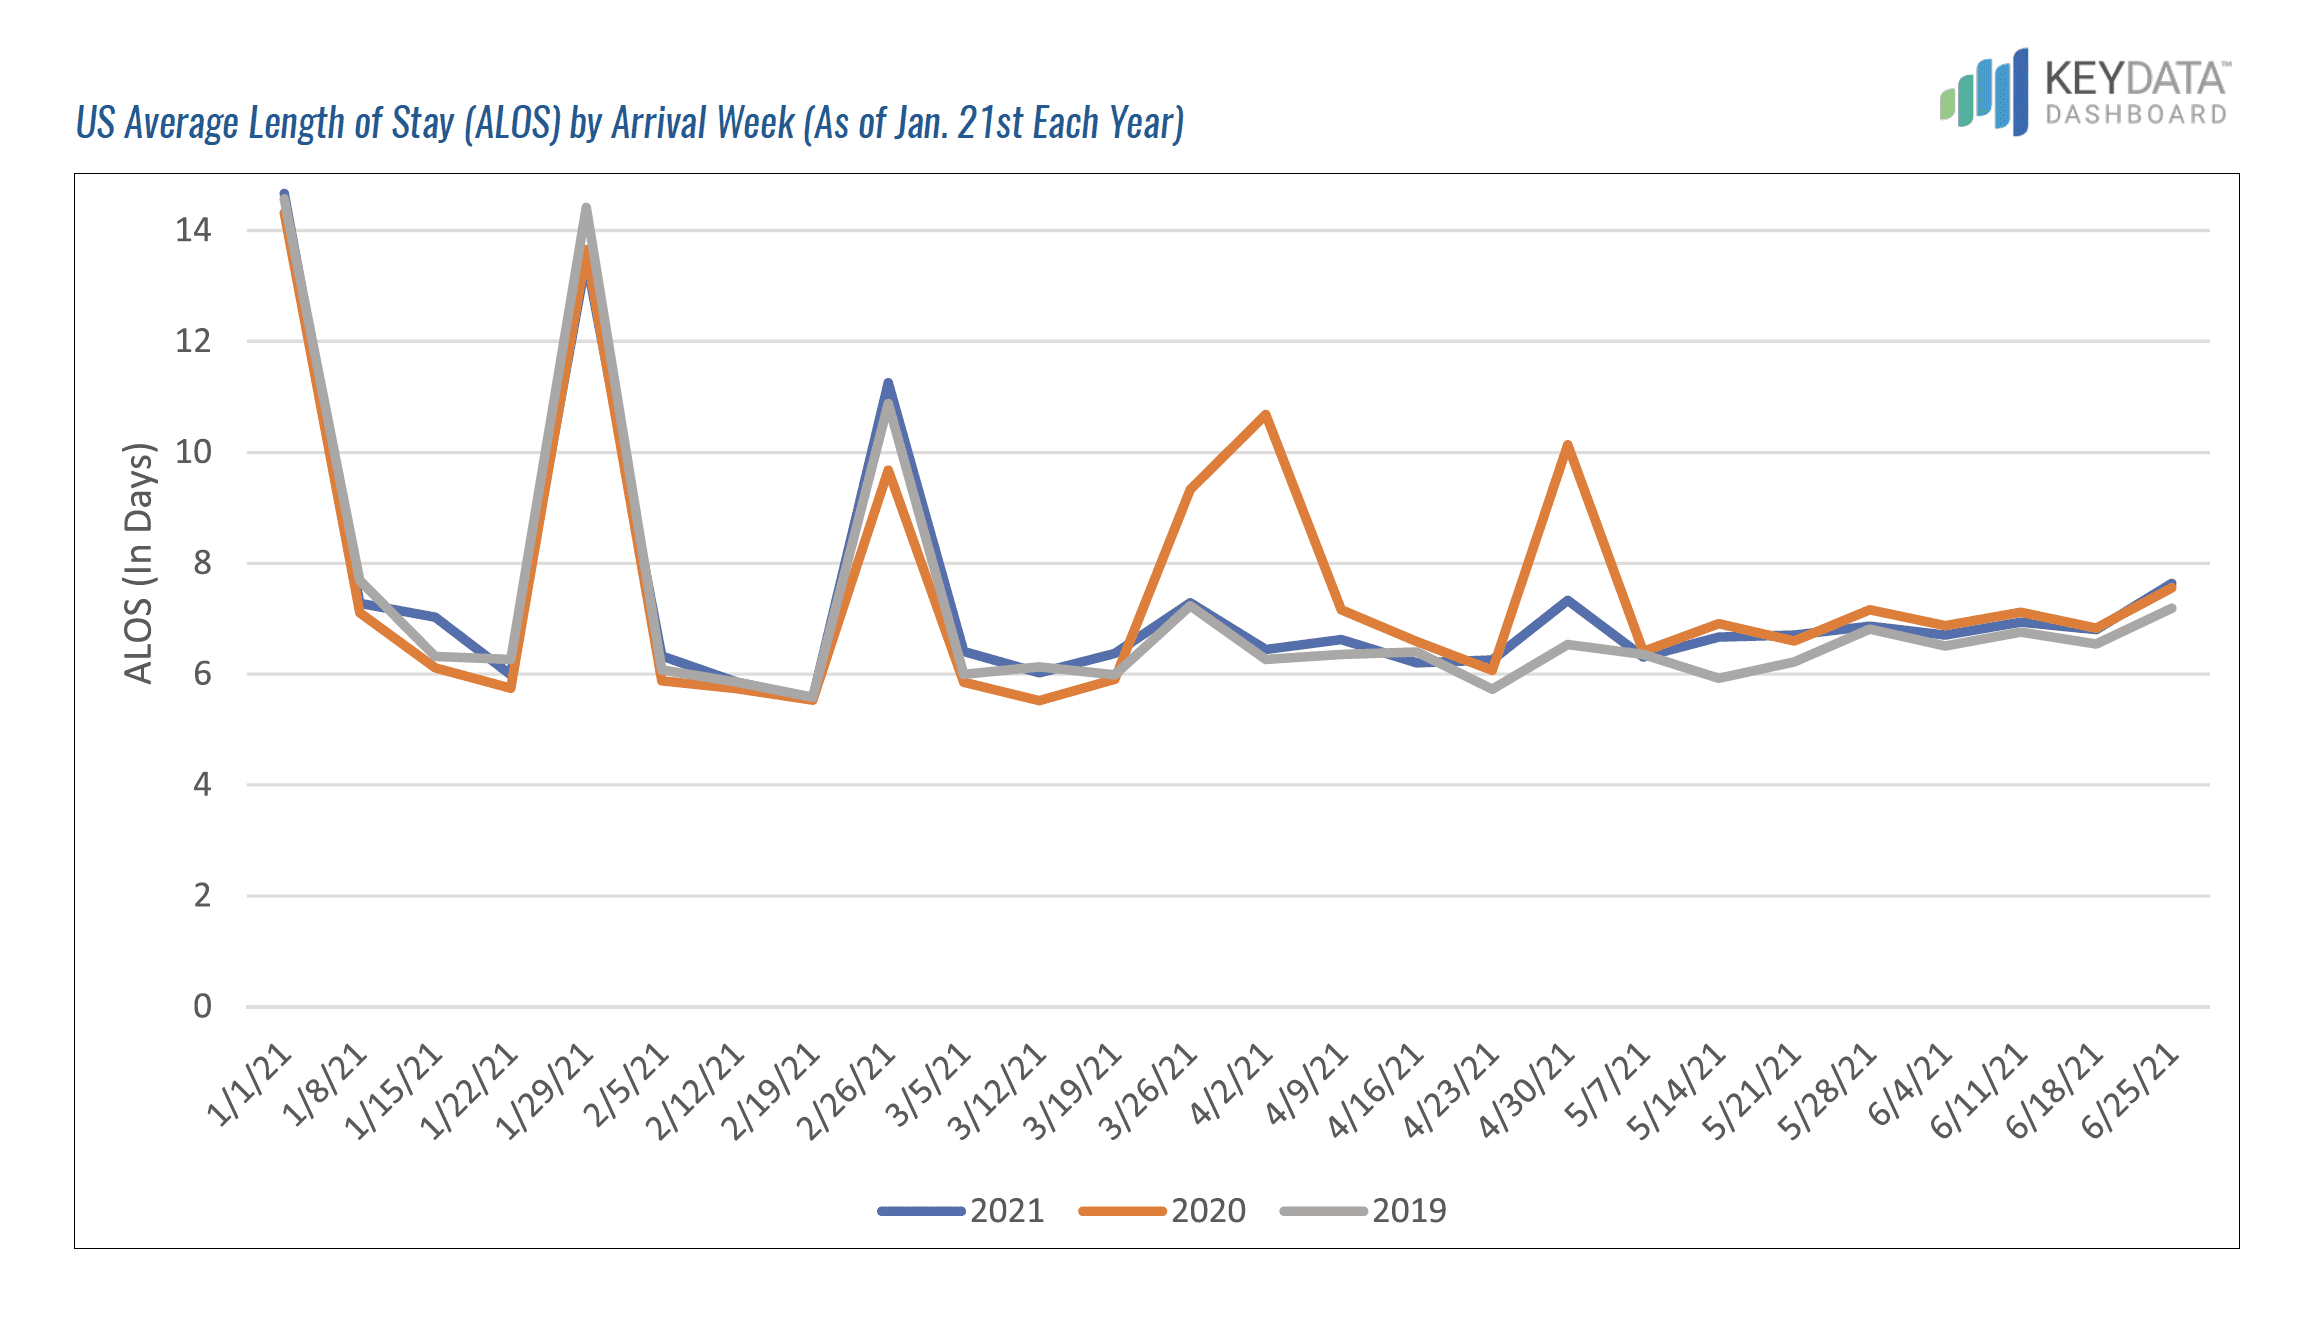
First, scraped data providers cannot distinguish between guest stays and owner stays or holds. Also, they have do not have visibility into cancellation data. They rely instead on algorithms or estimates to adjust for what they can see on the OTA websites. COVID-19 dramatically changed the expected percentages of holds and owner stays, making the data appear as if guests might be staying much longer when, in fact, much of what they were seeing were holds and owner stays.
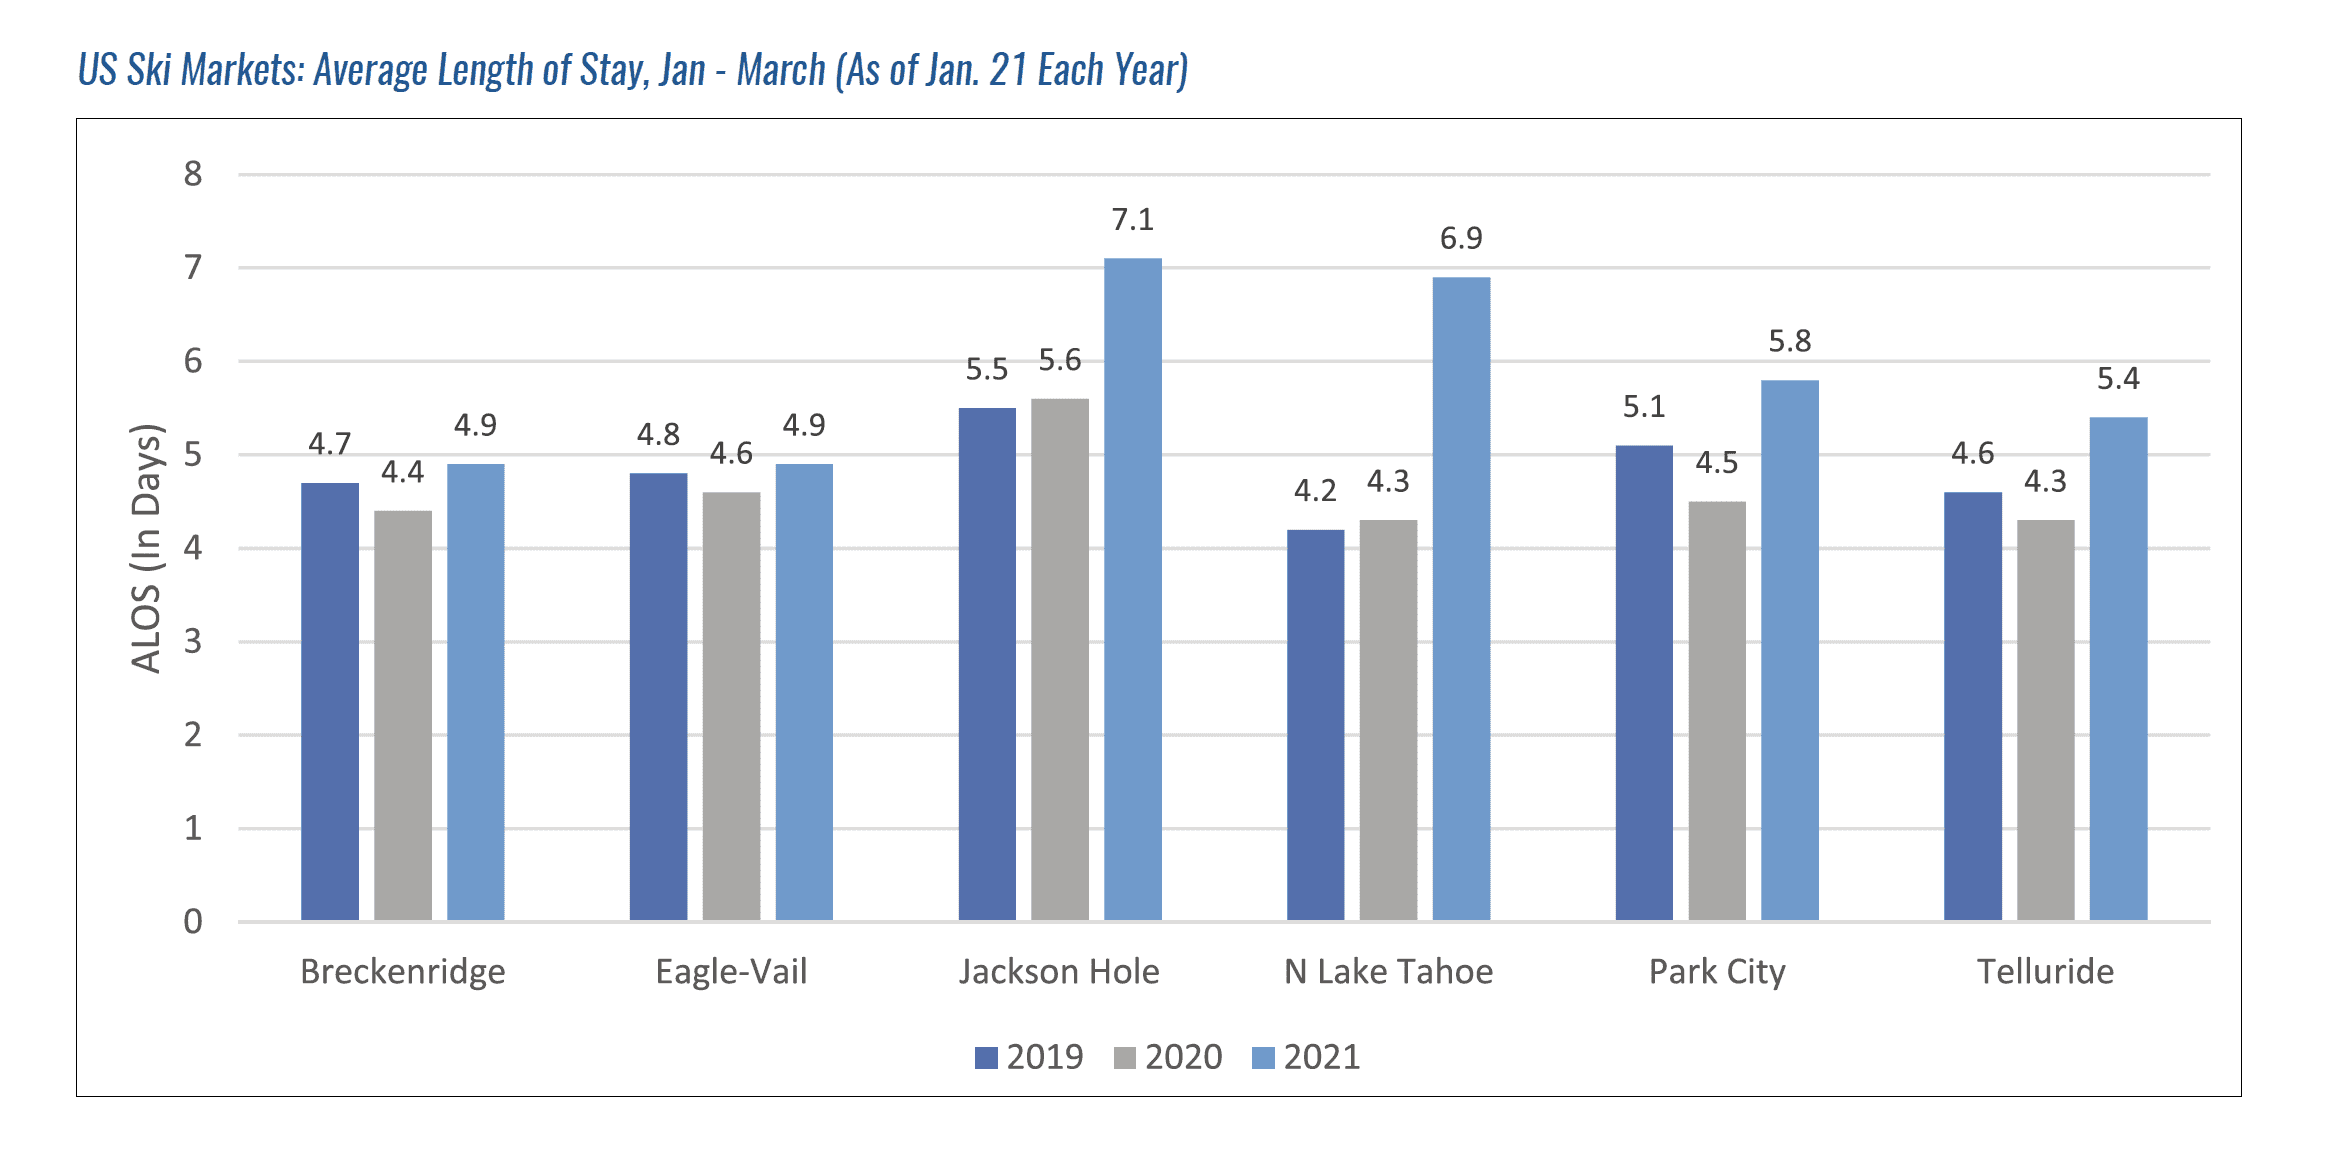
Second, several of the ski markets are seeing a bump in ALOS pacing for arrivals between January and March 2021 compared to last year. Although it doesn’t apply to all the markets, or even all the ski markets, it is enough to get folks talking.
Fact or Fiction? The Average Booking Window Has Shortened.
Answer: Mostly fact, but it varies by arrival time period.
Are guests still booking closer to their arrival date? The answer here is yes and no, depending on the month. Let’s take a more in-depth look.
For January through July arrivals, the 2020 booking windows were skewed heavily by COVID-19, reflecting a greater than 13 percent drop on average, down from 153 days to 137.
So let’s throw out 2020 and look at how 2021 is pacing versus 2019 and 2018. For the period as a whole, 2018 and 2019 were identical, both with an average of 158 days. This year is pacing 3 percent down at 153 days.
But the story here is in the details.
January and February bookings were made much closer to the day of arrival—67 average days in advance in 2021 versus 97/96 in 2019/2018, respectively.
Conversely, March–July bookings are being made much earlier this year—212 average days in advance in 2021 versus 190/188 in 2019/2018, respectively.
This makes sense. The struggle for the vaccine to catch up with rising cases is holding back early bookings, whereas pent-up demand for what hopefully will be a great summer is causing people who haven’t been able to travel to get their trips for summer on the books earlier.
Fact or Fiction? Houses Are Performing Better Than Condos.
Answer: Fact
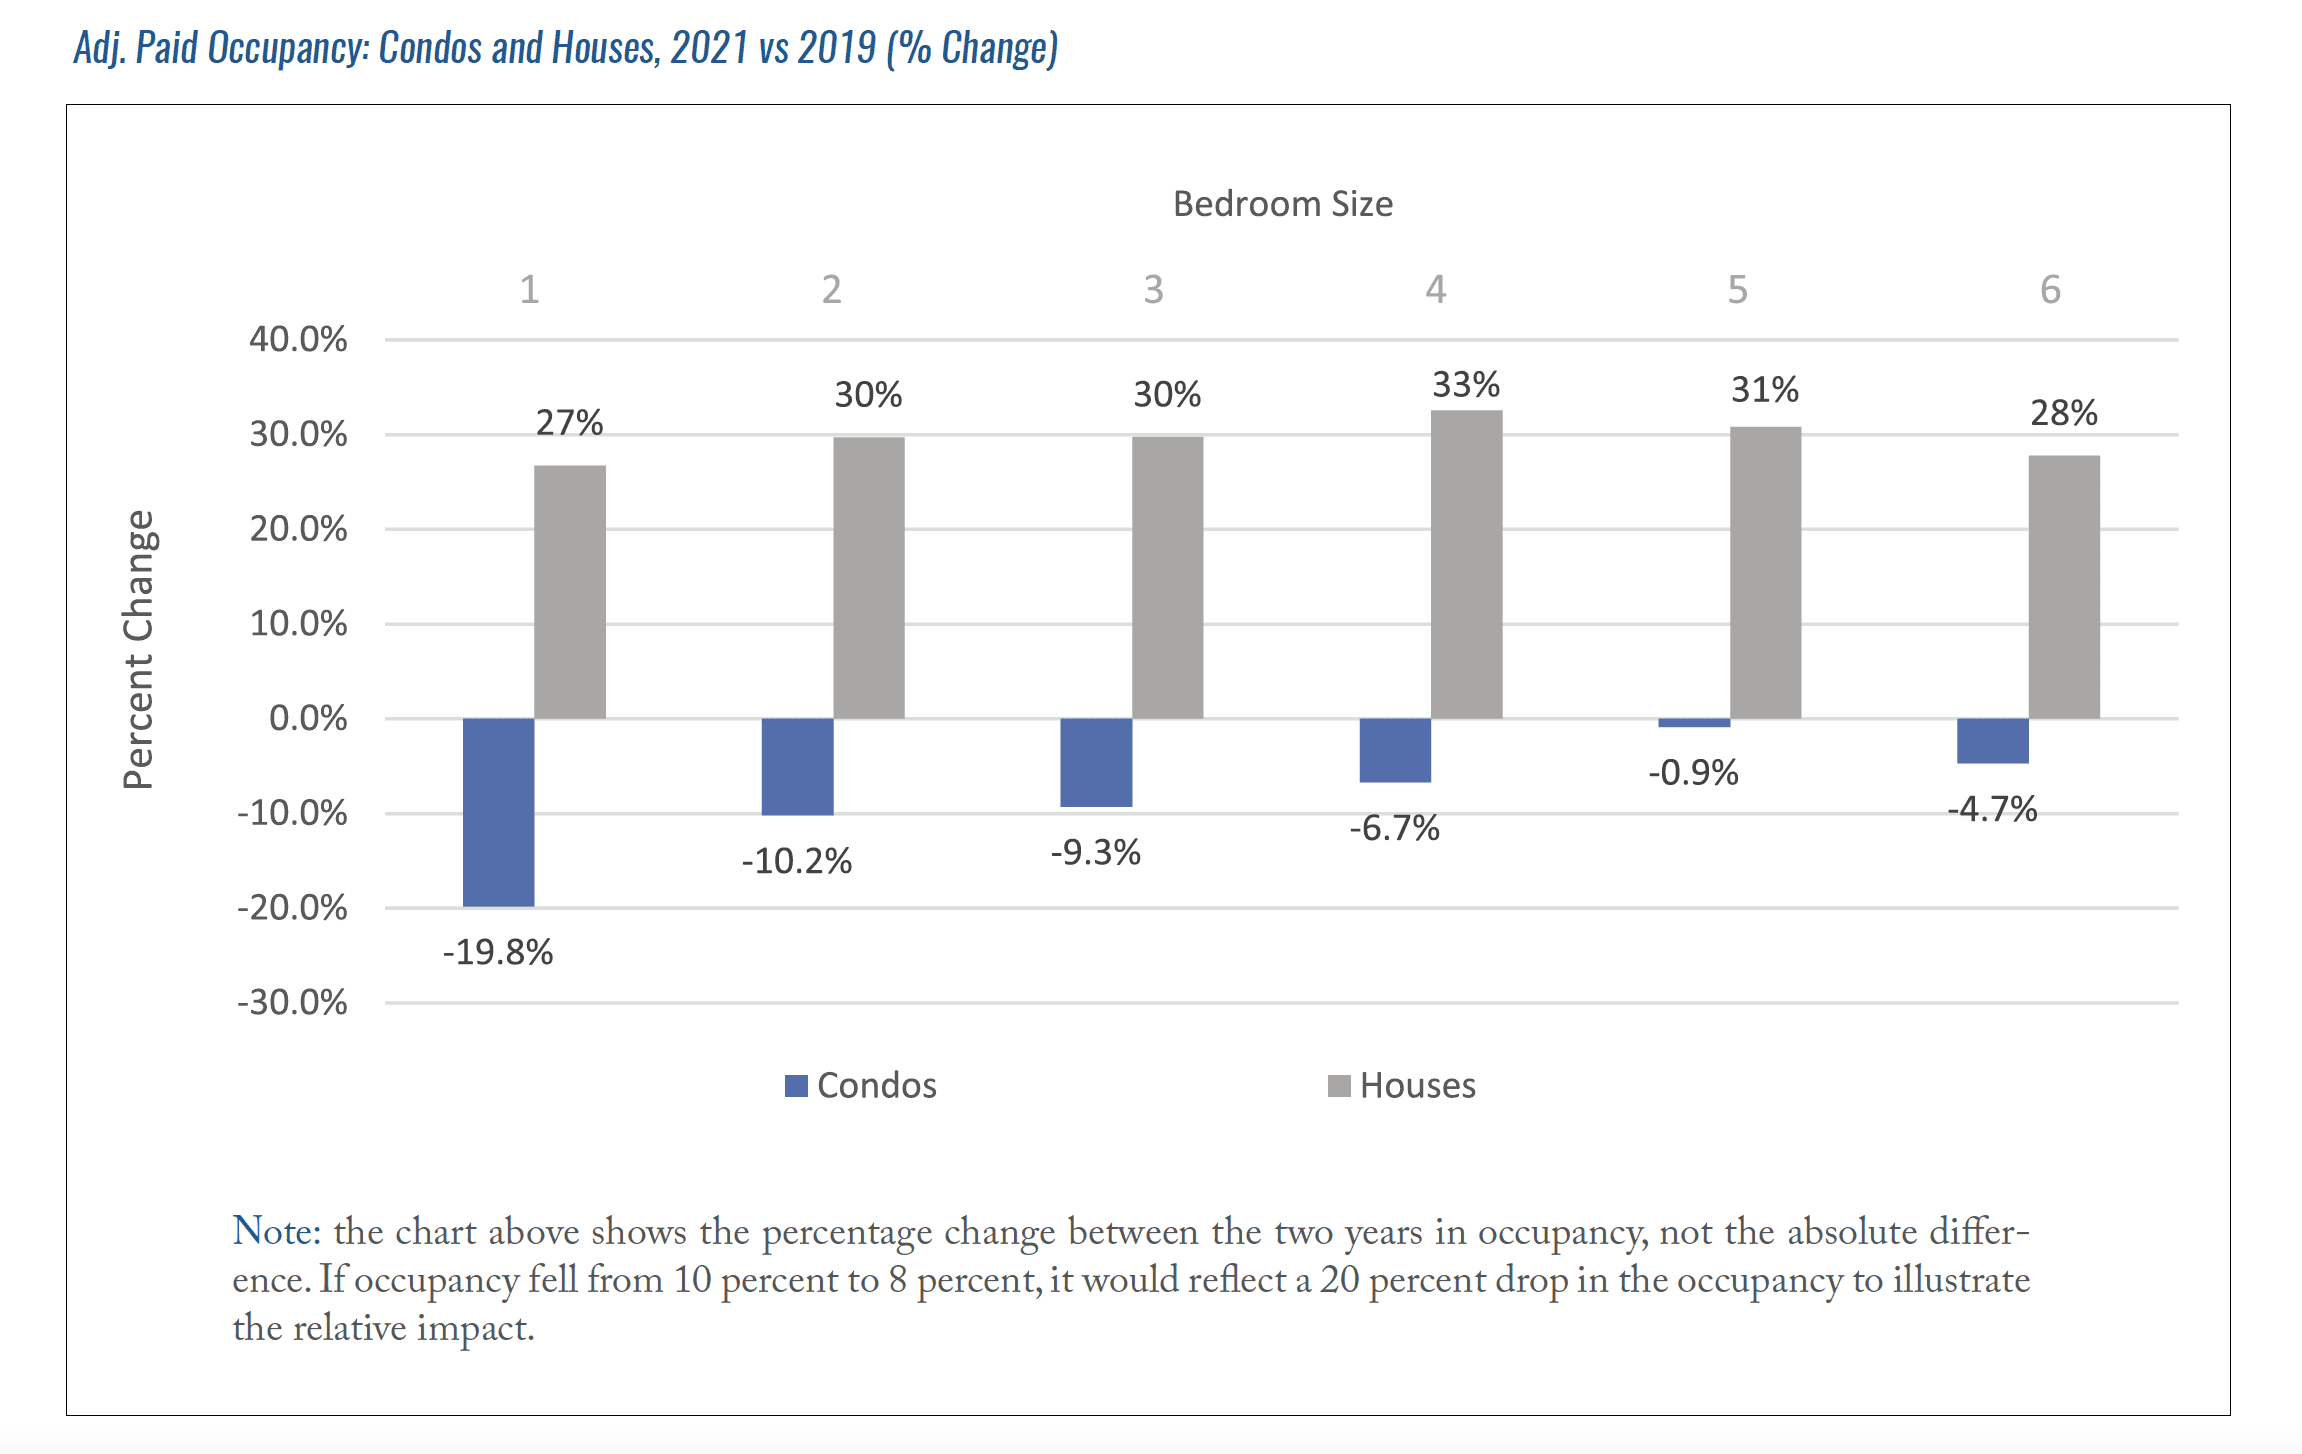
Condos, and small condos in particular, are not yet faring well in 2021. When looking at adjusted paid occupancy pacing for 2021 compared to 2019, houses are booking much better, whereas condos are booking much worse. It’s a sizable gap that shows a clear and strong trend across the US. In a COVID-19 period when private space matters and vacation rentals are vastly outperforming hotels, condos fall in between the two, as you might expect. Within our sector alone, they are profoundly underperforming and should be high on your list when considering marketing and rate adjustments.
Fact or Fiction? Large Houses Are Booking Better Than Smaller Houses.
Answer: Fiction
Are large houses booking better this year, as some suggest? The data says no. We looked at pacing for adjusted paid occupancy, comparing 2021 to 2019. Although 2021 occupancy pacing is higher, the pattern is the same each month.
Smaller houses booked better in January and as you look further out into the season.
Fact or Fiction? More Bookings Are Happening on Airbnb than Vrbo or Direct.
Answer: Fiction
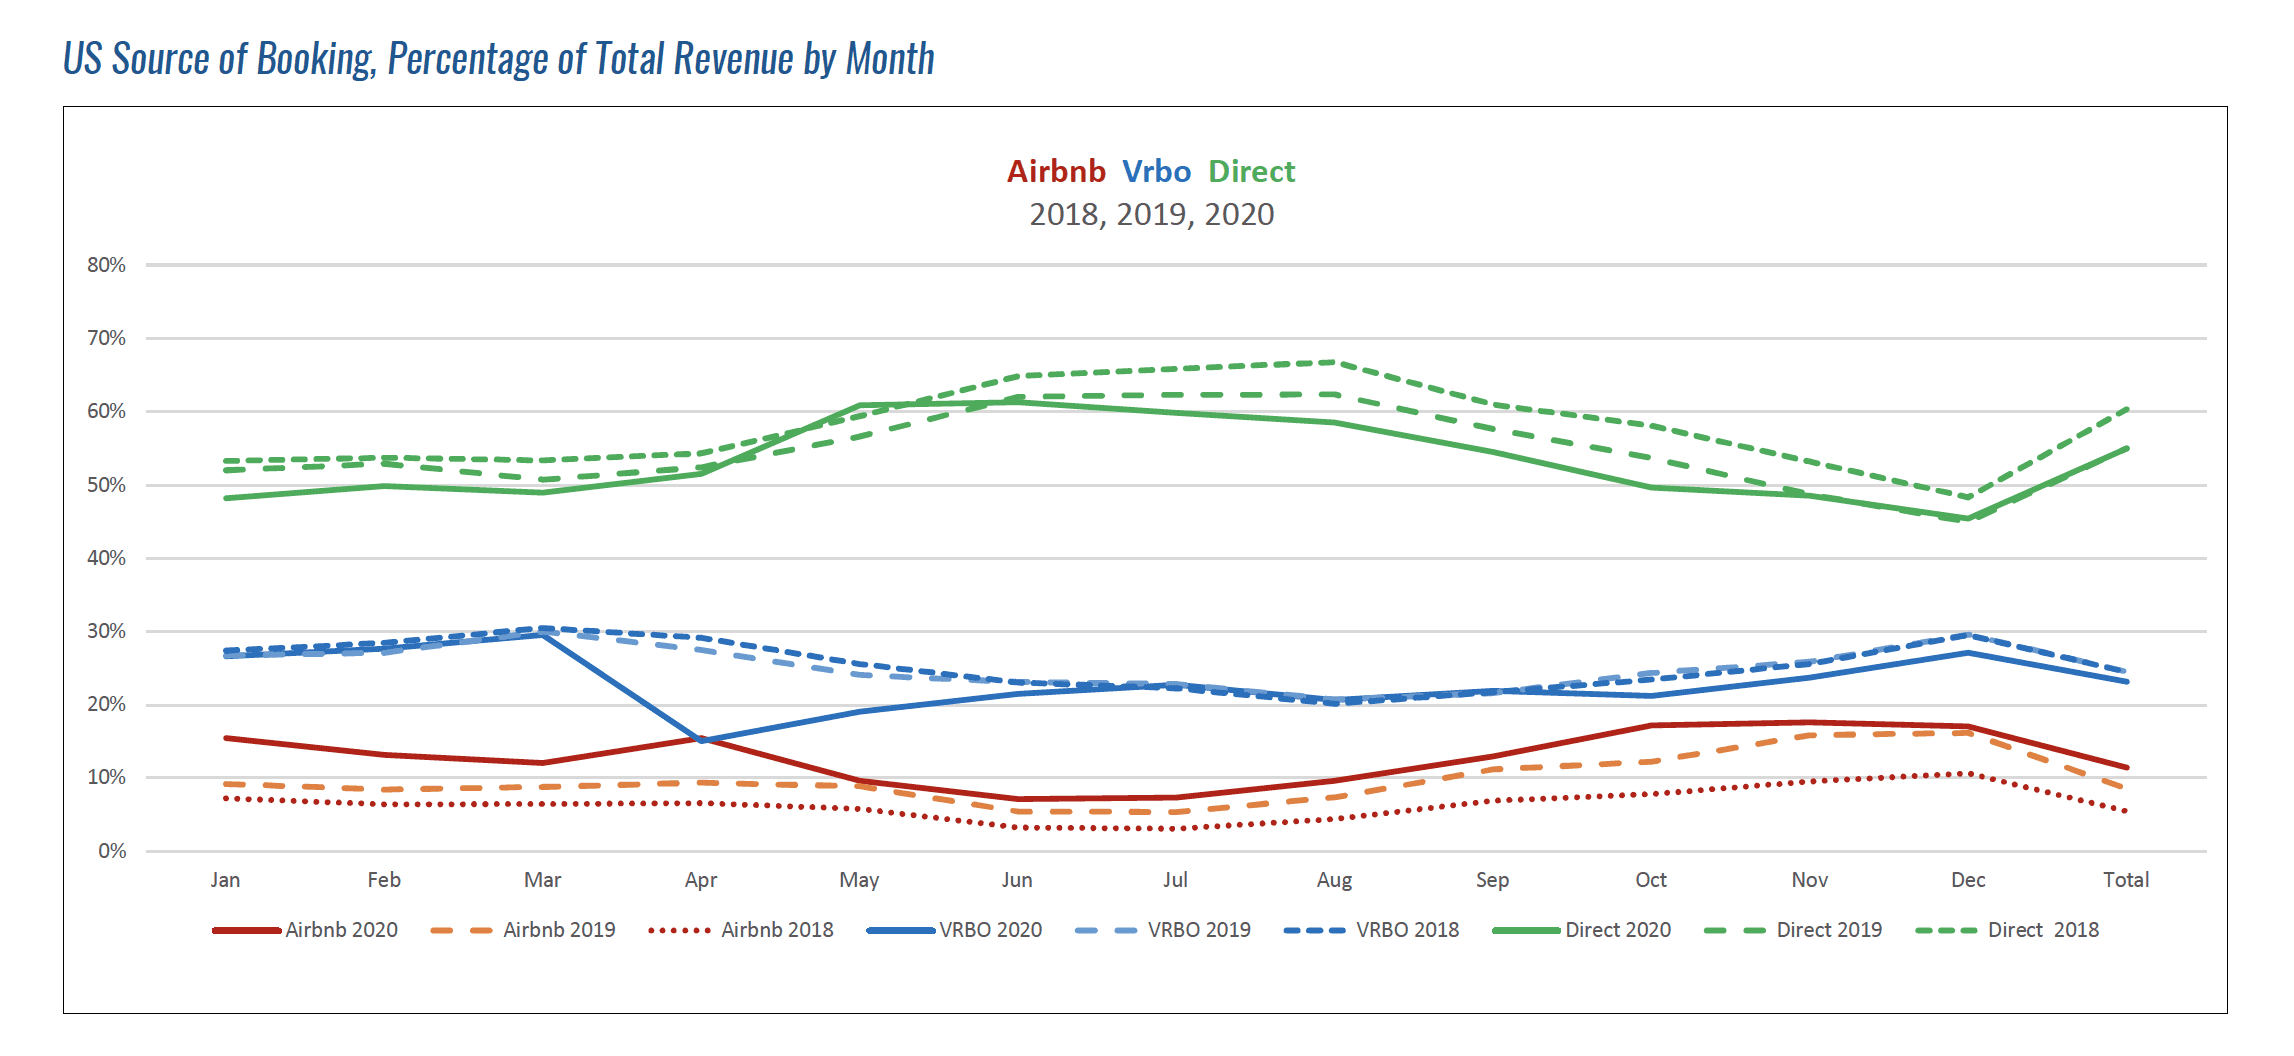
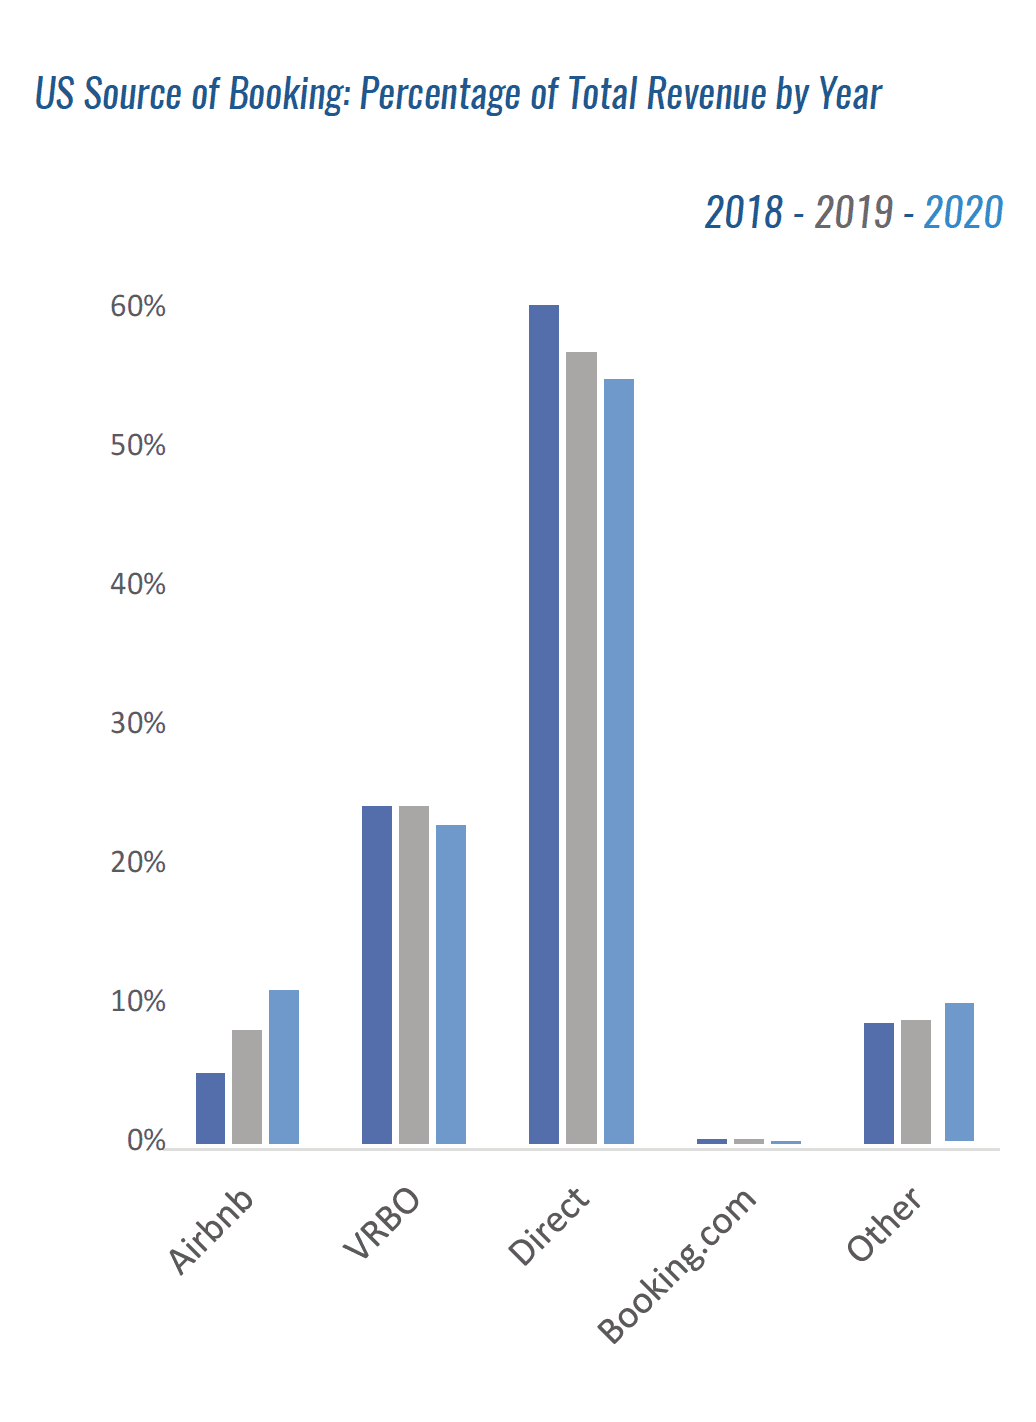 There is much speculation on how the OTAs are affecting each other and how professionals are keeping up with their push for direct bookings. Below we look for the first time at this data from the perspective of professional property managers on Key Data, which reflects significantly more of the leisure markets than the urban.
A few observations are clear for professional US managers in leisure markets:
Direct bookings continue to account for more than 50 percent of bookings.
Direct bookings vastly outperform any OTA.
Airbnb is slowly gaining some ground despite its lack of effort to work better with professionals, and the gain is coming off direct bookings.
VRBO is holding steady.
Note that Booking.com was less than 1 percent for this data set for all three years.
When we look at the data by month over this same three-year period, we see some additional seasonal trends:
VRBO is steady throughout the year.
Airbnb performs poorly in the summer months and stronger in the winter months.
Direct bookings capture the largest share in peak summer months.
The absence of bookings in April of 2020 skews the data that month. Otherwise, the trends are consistent.
As professionals know, each market is different, and understanding how these trends are playing out in your specific market(s) is more important than ever after a year that reset much of what we’ve all come to expect.
