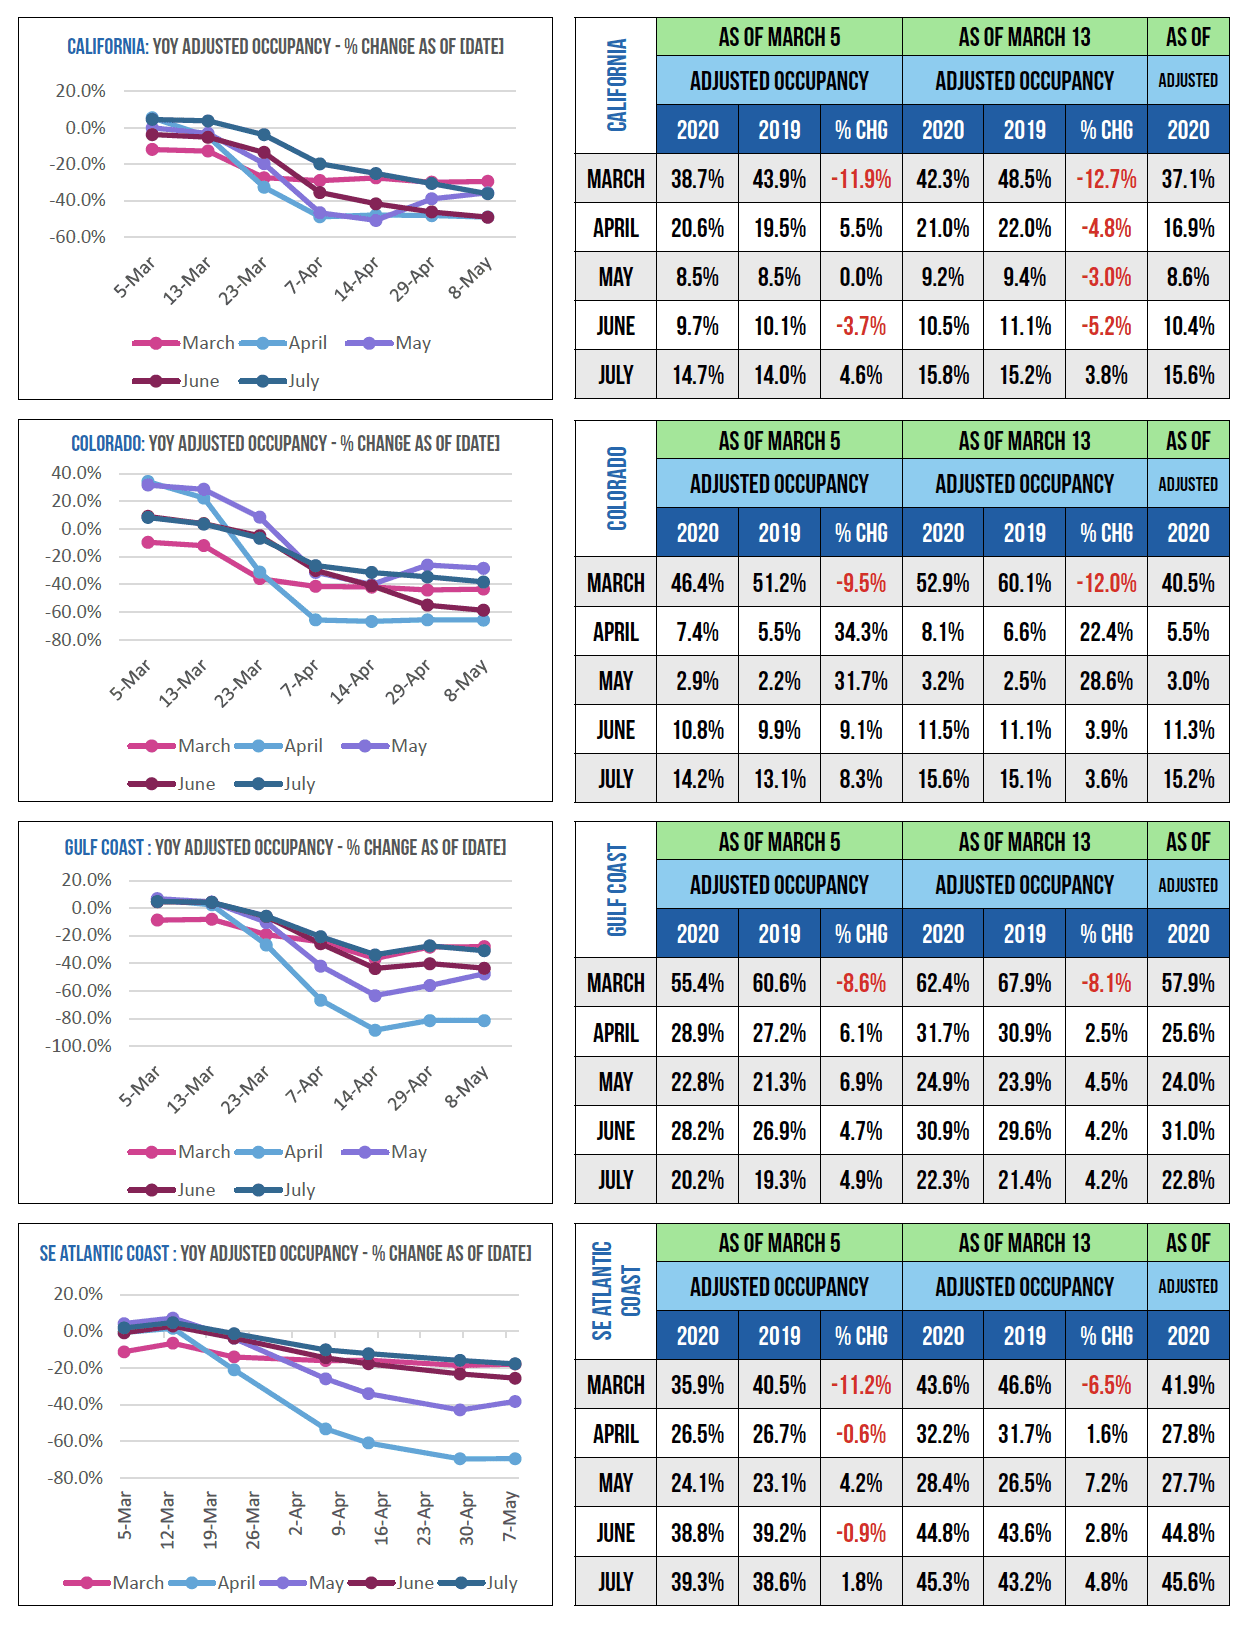
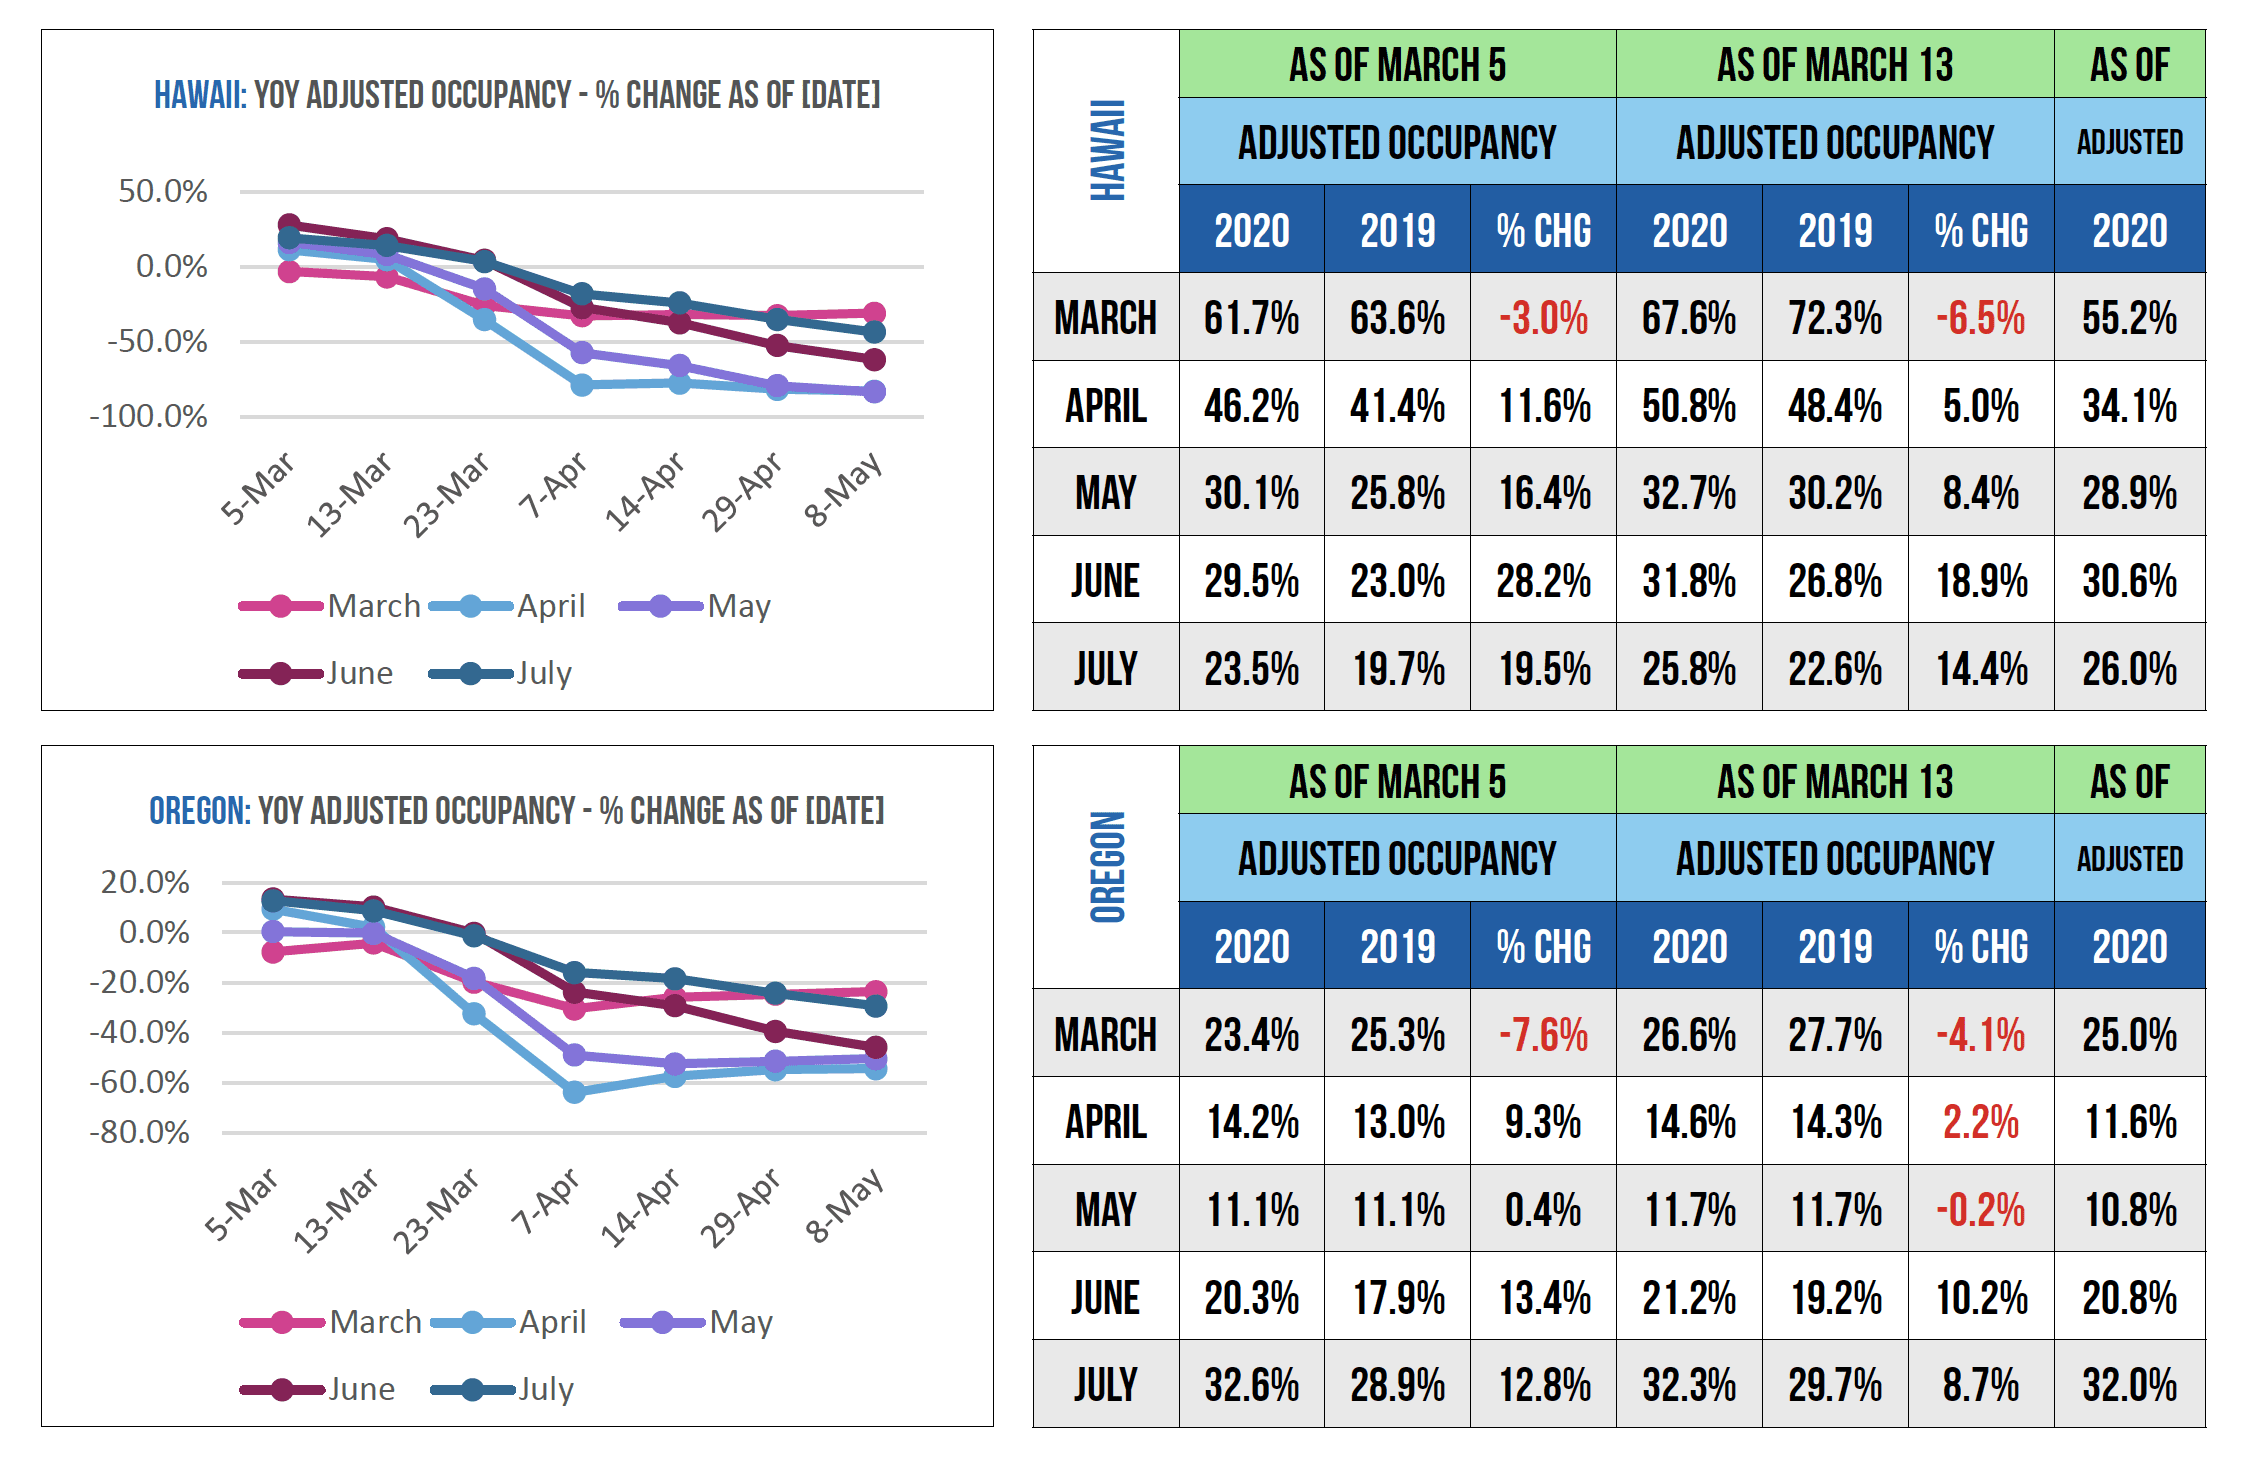
As the United States slowly awakened to the reality that COVID-19 was putting a halt on travel, Key Data Dashboard’s Melanie Brown and I began tracking the pandemic’s effect on the forward-looking booking pace, taking snapshots of data for six regions: Hawaii, Oregon, California, Colorado, the Gulf Coast, and the Southeastern Atlantic Coast.
Beginning on March 5, we documented the adjusted occupancy rate booked on that day and compared it to the same metric on the same day in 2019, looking ahead monthly to March, April, May, June, and July. We then continued to pull these same data sets every seven to 14 days through May 8 to track how vacation rental travel bookings were comparing to 2019.
The data sets provide a piece of history—one we have not had until recently with the wide adoption of benchmarking data.
How to Read the Data
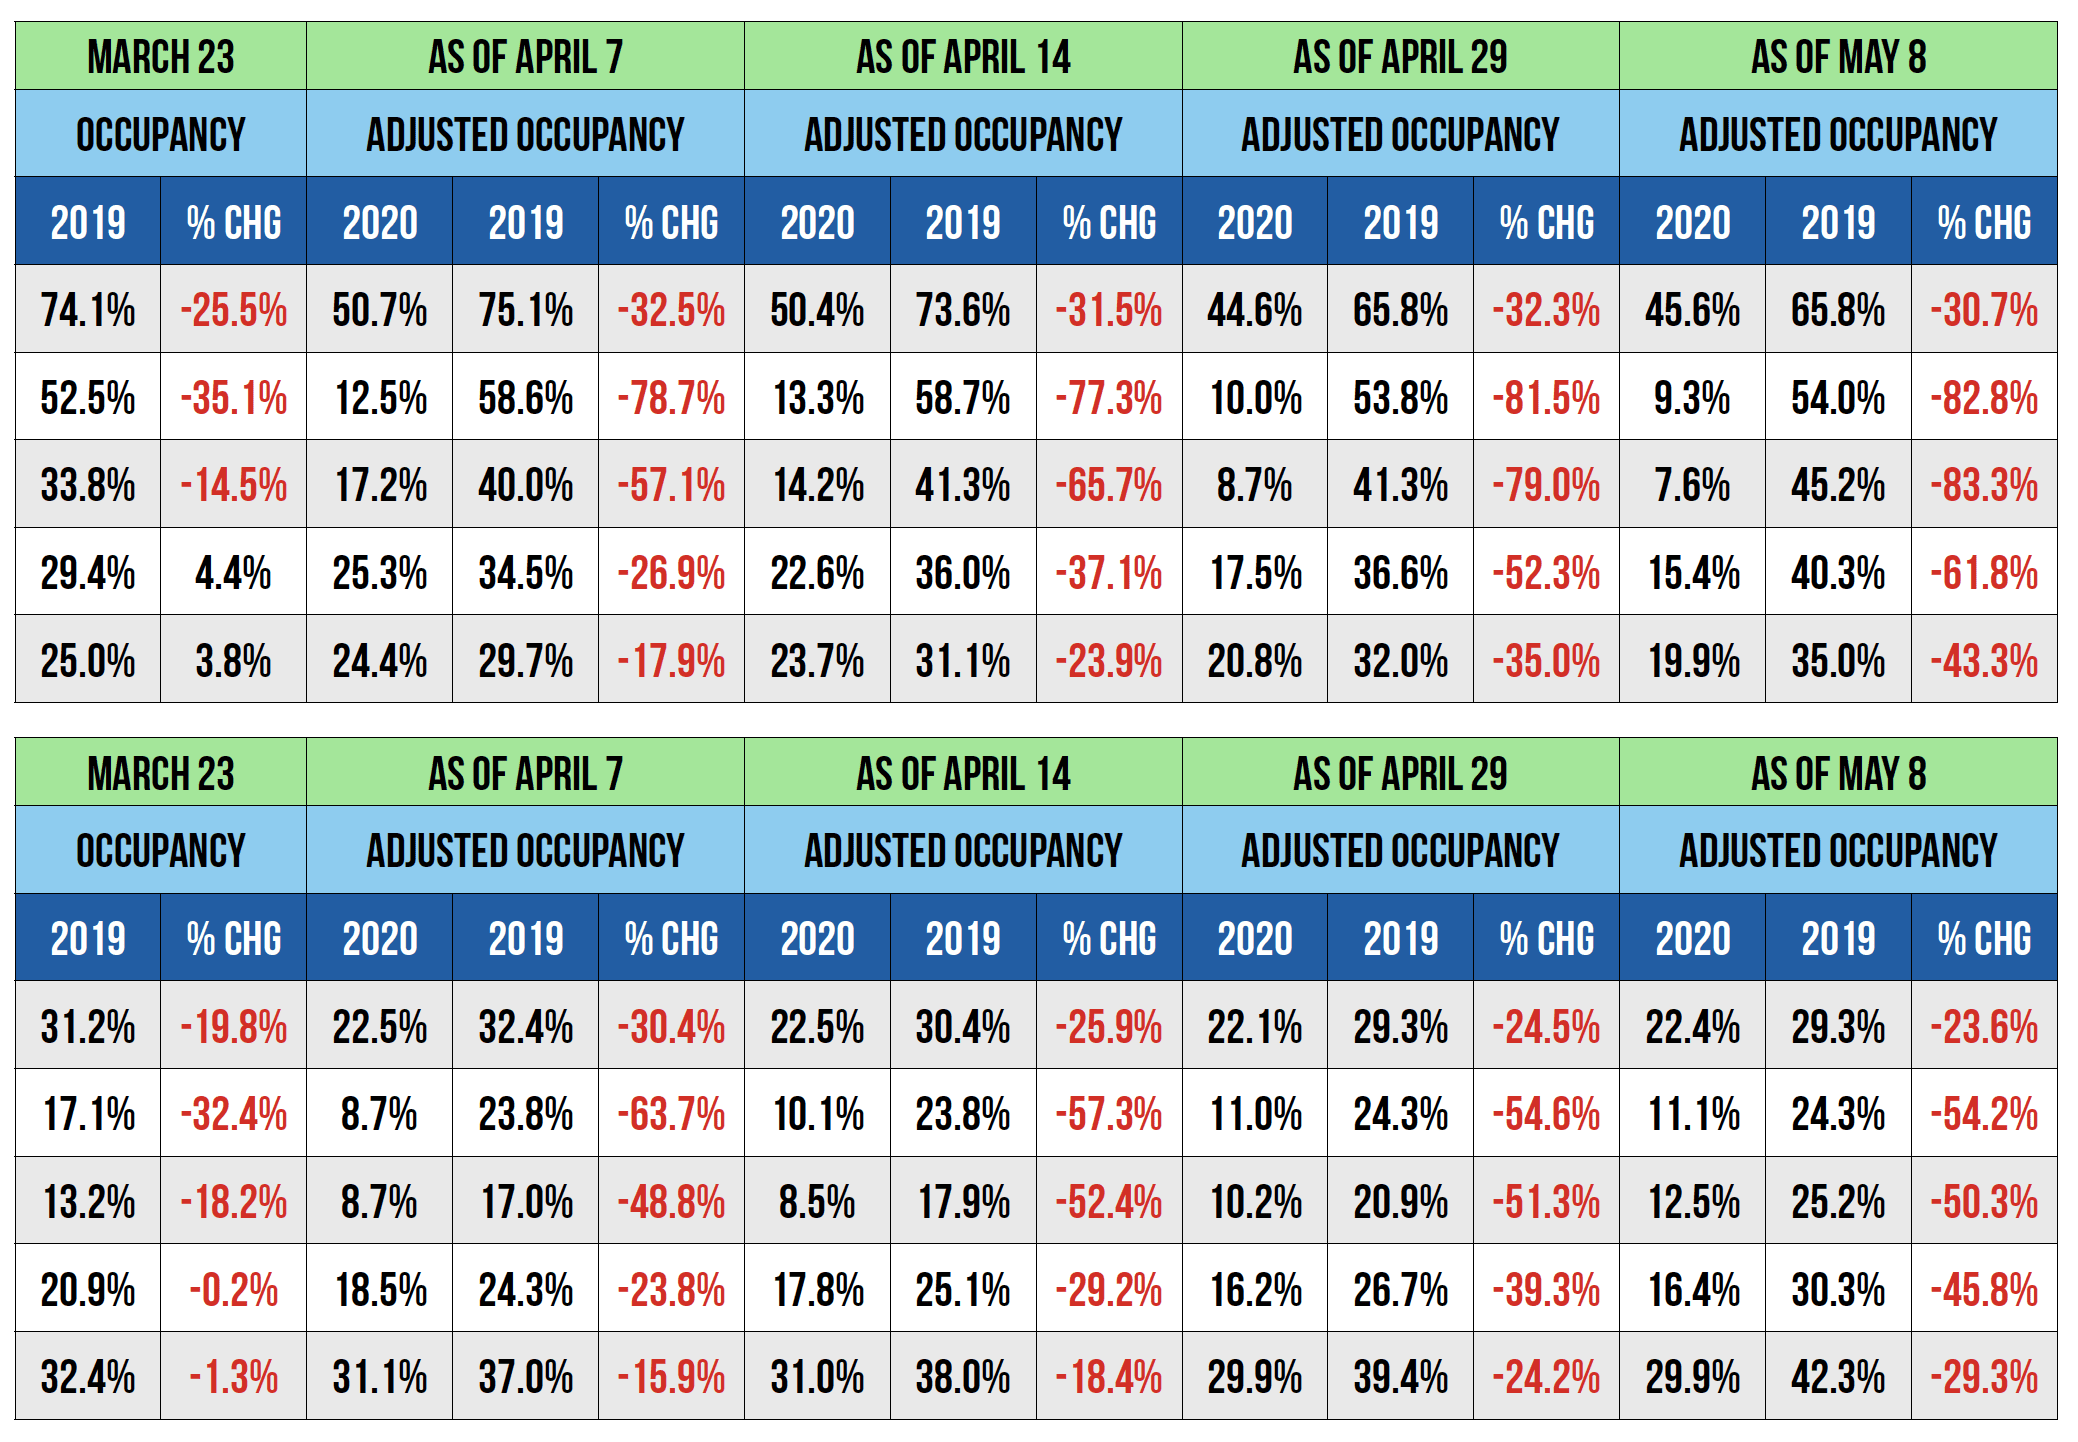
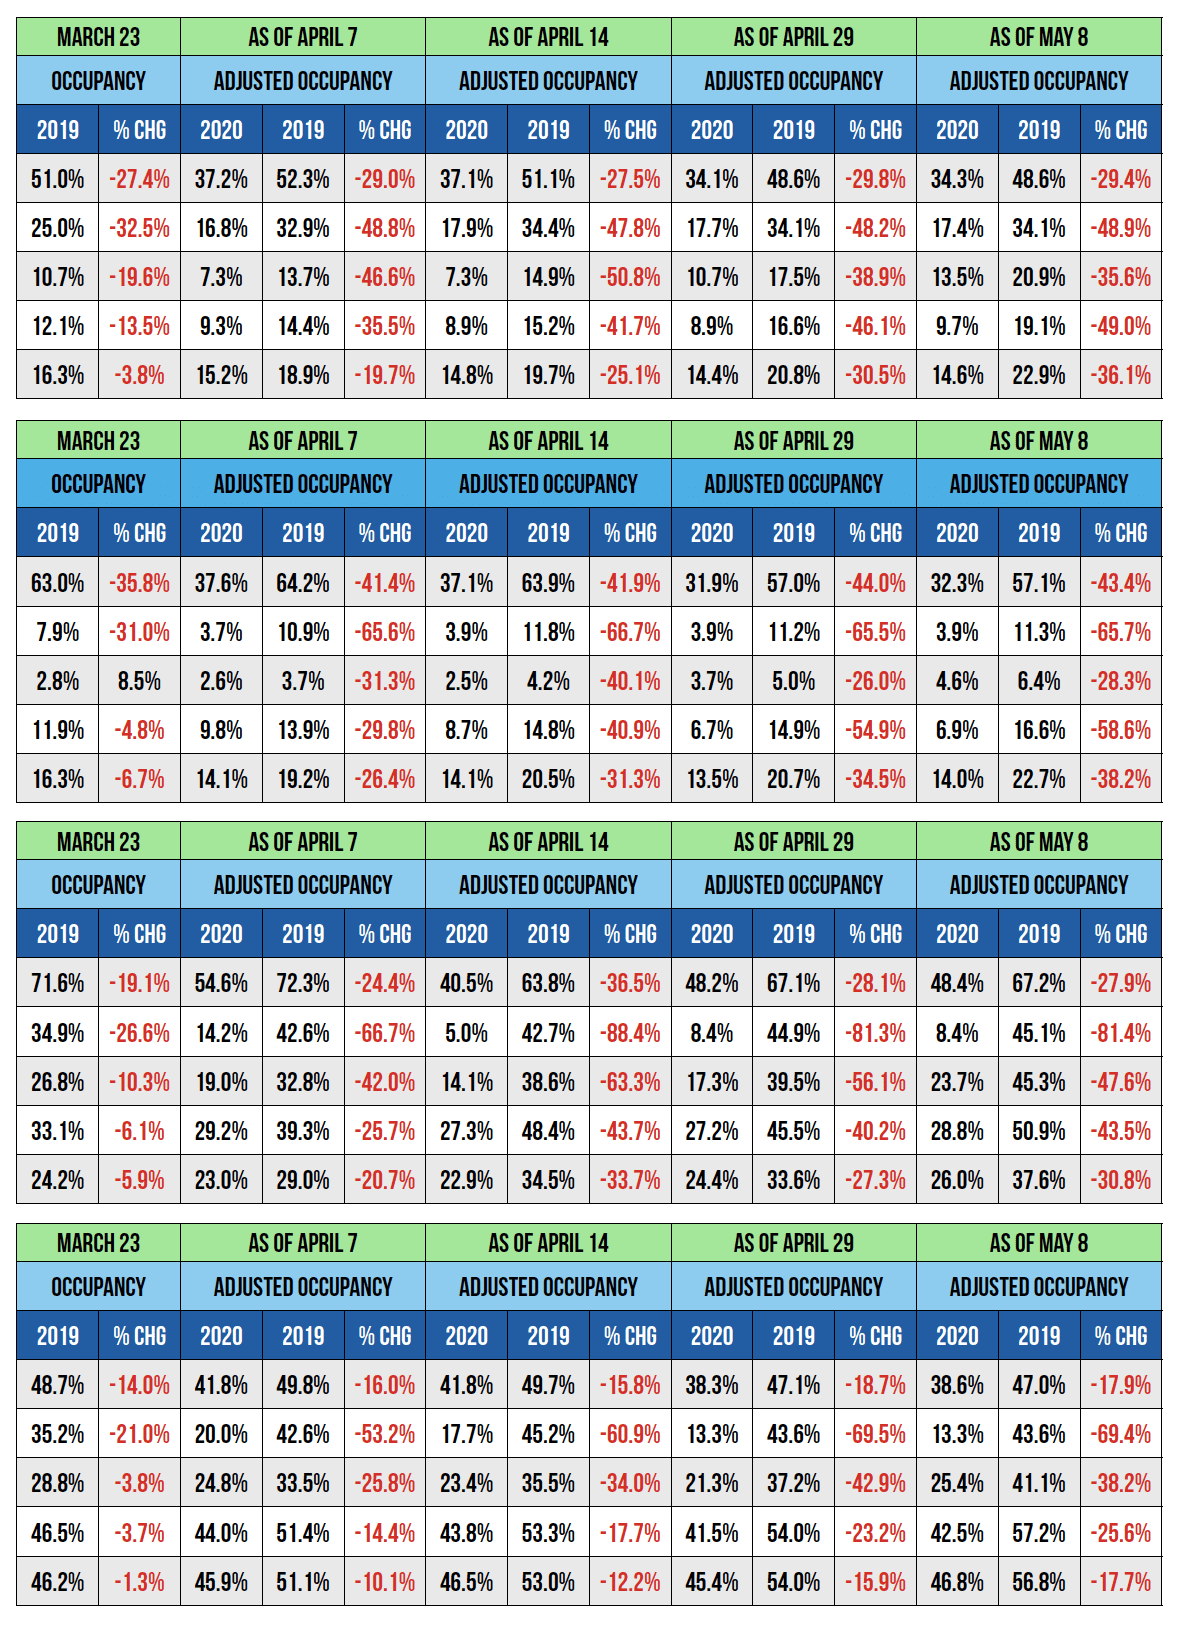
As you will see in the charts and tables below, each region’s data set is characterized by an “as-of ” date (e.g., Hawaii: YOY Adjusted Occupancy As of March 5). The “Adjusted Occupancy” rate represents reservations on the books as of March 5, 2020, compared year over year to reservations on the books as of March 5, 2019.The “Adjusted Occupancy” metric measures paid occupancy, or nights available to rent, and excludes owner stays and maintenance holds.
The data sets then compare this booking pace for 2019 and 2020 as of March 5, March 13, March 23, April 7, April 14, April 29, and May 8. Key Data sources and aggregates its data from thousands of professionally managed vacation rental companies and compiles it using direct API-driven connection with property management software systems.
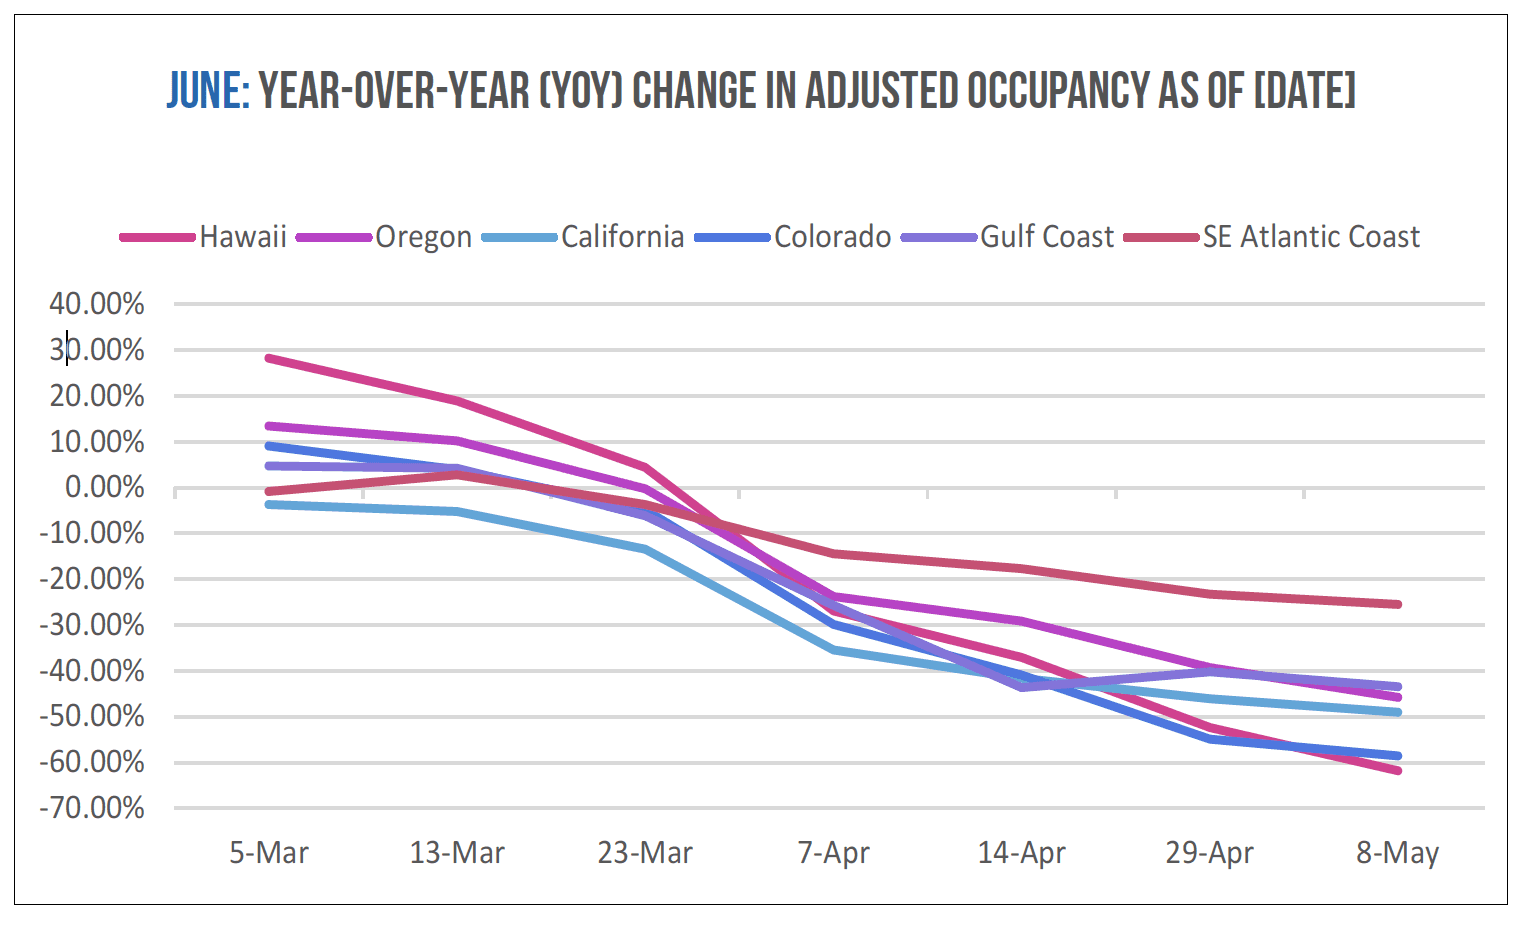
Now that we have benchmarking data, we must learn how to interpret it. For example, the chart to the right tracks June’s YOY change in adjusted occupancy rates across all the regions we examined “as of ” the days on which we took snapshots. For example, the SE Atlantic Coast region’s bookings are still pacing 25 percent below 2019 for June occupancy booked as of May 8, 2020, compared to occupancy booked as of May 8, 2019.